#1497 closed bug (fixed)
colormap edge case handling wrong for negative valued rasters
| Reported by: | Barryrowlingson | Owned by: | ersts |
|---|---|---|---|
| Priority: | major: does not work as expected | Milestone: | |
| Component: | Rasters | Version: | Trunk |
| Keywords: | Cc: | ||
| Must Fix for Release: | No | Platform: | Linux |
| Platform Version: | Awaiting user input: | no |
Description
I have a single-band floating-point raster. It's 20x20 so I can see the cells.
From layer properties choose 'Colormap', on the Colormap tab use Discrete Color Interpolation, in generate new color map section choose 4 entries, equal interval color map, hit Classify, hit apply.
The colormap values define inclusive upper values. For a positive-valued raster I get three areas of color and a single cell coloured in the shade of the smallest value, since that's the only cell which has the minimum value.
But for a negative-valued raster I get three areas of colour and a blank cell at the highest value.
Let's explain with some colormaps. My positive raster has a range of 0.563 to 8.38, and I get this colormap:
0.563: blue 3.169: yellow 5.775: green 8.38 : red
I see one blue cell (at the single pixel with the minimum value) and some yellow, green and red cells. All cells are shaded.
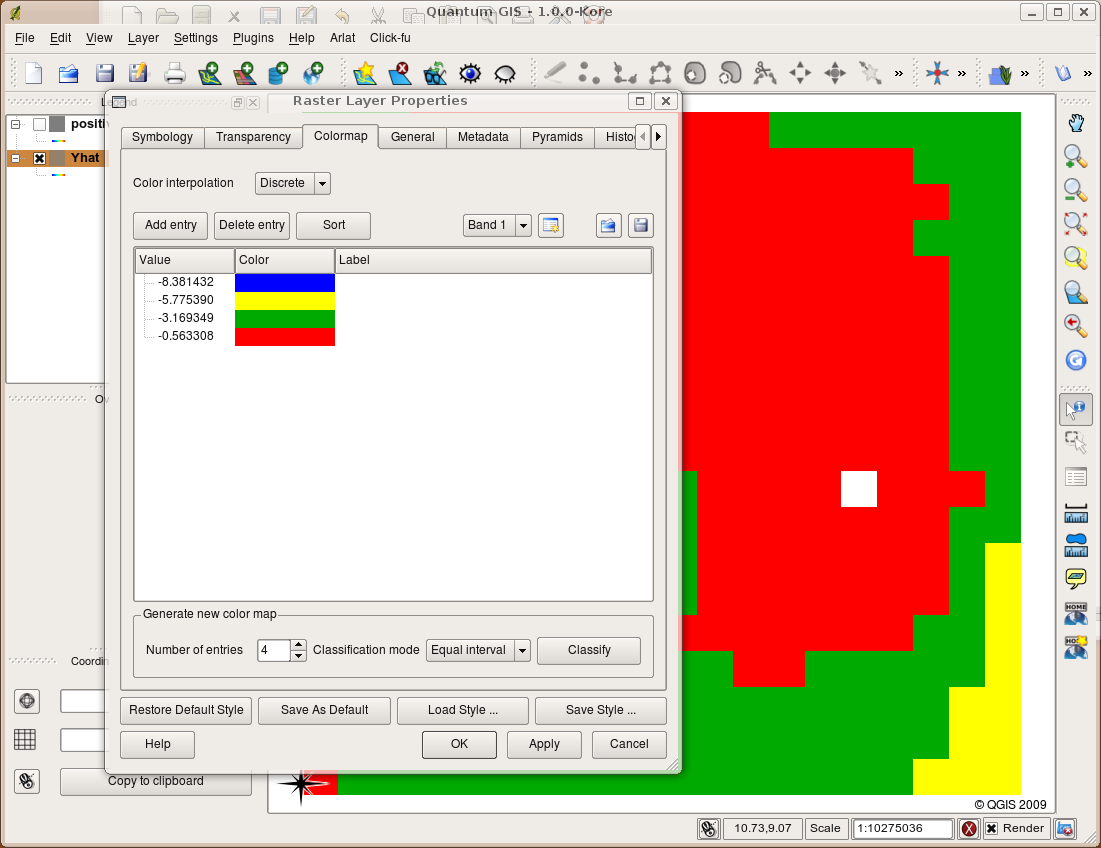
With my negative raster (which is just (* -1 pos) in RasterLang) I get the following colormap:
-8.38 : blue -5.775: yellow -3.169: green -0.563: red
and I see one transparent cell, no blue cells, and some yellow, green and red cells. The transparent cell is at the -0.563 value location. See attachment.
If things were symmetric with the positive raster, it should be red, but it doesn't get shaded.
As it is, it seems that a positive floating point raster will always have cells of the single max colour done in one shade, and a negative fp raster will always have cells of the minimum colour set transparent...
Also note the 'Exact' interpolation doesn't match any cells - I thought it might find equality with the min and max cells, but doesn't. Probably only useful for integer rasters.
Attachments (1)
Change History (6)
by , 15 years ago
| Attachment: | 2009-01-20-122414_1101x848_scrot.png added |
|---|
comment:1 by , 15 years ago
| Owner: | changed from to |
|---|---|
| Status: | new → assigned |
Replying to Barryrowlingson:
If things were symmetric with the positive raster, it should be red, but it doesn't get shaded.
As it is, it seems that a positive floating point raster will always have cells of the single max colour done in one shade, and a negative fp raster will always have cells of the minimum colour set transparent...
If there is a pixel > -0.563 it should be shaded red, but if there is a pixel < -8.38 it will not be shaded.
Check out the trunk and see if your problem still exists. I am not sure I totally understand your explanation and may be missing something. If the problem still exists, please post an ascii version of your 20x20 grid and your color map.
Also note the 'Exact' interpolation doesn't match any cells - I thought it might find equality with the min and max cells, but doesn't. Probably only useful for integer rasters.
Check your values outside of qgis, or better yet try with an ascii grid. It should work for all data. Part of the issue has to do with gdal gives data as float but it is used throughout the raster class as doubles and the problem comes down to comparing the type of values. Your color map entry may be 1.05 but the value may be 1.050000000000001 in the data. This issues shows up with the no data value as well. Really need to go back to if( Value1 - Valu2 ) < some constant ( e.g. 0.0000000001 ) Consider the values equal.
comment:2 by , 15 years ago
Hmm I've just tried with some other rasters and it doesn't happen, so it's dependent on the values in the raster.... I'm trying to create a minimal raster that reproduces the problem. Will post later.
If it's a problem with precision it's not my fault - Qgis is creating the classification edges and so ought to make sure all the data is within the bounds.
comment:3 by , 15 years ago
Here's two 3x2 esri grid files - one exhibits the problem, the other doesn't:
NCOLS 3
NROWS 2
CELLSIZE 0.9125
XLLCORNER 12.15
YLLCORNER -5.81
NODATA_value  -26
-2.66226 -2.720158 -3.119102
-1.747691 -1.321416 -1.096483

NCOLS 3
NROWS 2
CELLSIZE 0.9125
XLLCORNER 12.15
YLLCORNER -5.81
NODATA_value  -26
-2.66226 -2.720158 -3.119102
-1.747691 -1.321416 -1.196483
the only difference between them is I've changed the max value from -1.096483 to -1.196483.
For the first grid, that cell shows up as white, for the second grid it is coloured okay.
Recap: load grid, Properties, set 'Colormap' mode, on colormap tab choose 4 entries, classify, apply.
This is on 1.0.0 Kore release - I've not got a build environment up at the moment. If all this has changed a lot in HEAD then maybe it's all fixed. I might try and sort out building later.
thx for looking into this.
comment:4 by , 15 years ago
| Resolution: | → fixed |
|---|---|
| Status: | assigned → closed |
It is was I expected, a problem comparing doubles. Even thought -1.196483 was in the ascii grid and the color map the == comparison was not returning true.
I would like folks to test this a little more before merging it into the V1.0 branch.
colormap and raster - note white pixel at max value of raster