
Opened 8 years ago
Last modified 5 years ago
#3300 new defect
v.rast.stats: wrong results for non-first category values in the case of multiple category values per feature
| Reported by: | mlennert | Owned by: | |
|---|---|---|---|
| Priority: | normal | Milestone: | 7.8.3 |
| Component: | Vector | Version: | unspecified |
| Keywords: | v.rast.stats overlap | Cc: | |
| CPU: | Unspecified | Platform: | Unspecified |
Description 
From a discussion and test on the users mailing list [1]:
v.rast.stats seems to incorrectly take into account the non-first cat values when there are multiple cat value per polygon.
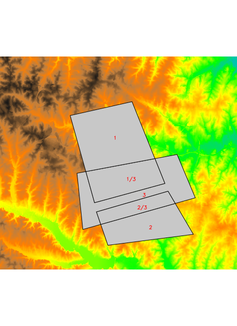
See the attached image for an example of a situation with several polygons of which polygon 3 overlaps with respectively 1 and 2.
I also created a second file with only the 2 non-overlapping polygons (cat 1 and 2). The two input file were created in QGIS so as to be able to have "nice" topologically incorrect data.
I'll attach a .pack file of the test vector map with the three overlapping polygons.
test_nooverlap can be created from test with
v.extract -d test cat=1,2 out=test_nooverlap
I then imported the two files into GRASS GIS with v.in.ogr and ran
v.rast.stats map=test raster=elevation column_prefix=e
v.rast.stats map=test_nooverlap raster=elevation column_prefix=e
And here are the results:
> v.db.select test
cat|id|e_number|e_minimum|e_maximum|e_range|e_average|e_stddev|e_variance|e_coeff_var|e_sum|e_first_quartile|e_median|e_third_quartile|e_percentile_90
1|1|242621|76.8941955566406|145.712738037109|68.8185424804688|114.397437714797|13.5650727983398|184.01120002426|11.8578467047128|27755220.7358017|104.996|115.337|124.654|131.38
2|2|131854|77.3364105224609|126.733070373535|49.3966598510742|99.4588066985328|10.6819214497898|114.103445859479|10.7400458585508|13114041.4984283|91.5773|98.7388|106.926|114.645
3|3|99039|71.4758224487305|139.941131591797|68.4653091430664|107.223648245541|13.7481896908839|189.012719776527|12.8219752972784|10619322.8985901|97.4993|105.891|118.752|126.703

> v.db.select test_nooverlap
cat|id|e_number|e_minimum|e_maximum|e_range|e_average|e_stddev|e_variance|e_coeff_var|e_sum|e_first_quartile|e_median|e_third_quartile|e_percentile_90
1|1|242621|76.8941955566406|145.712738037109|68.8185424804688|114.397437714797|13.5650727983398|184.01120002426|11.8578467047128|27755220.7358017|104.996|115.337|124.654|131.38
2|2|131854|77.3364105224609|126.733070373535|49.3966598510742|99.4588066985328|10.6819214497898|114.103445859479|10.7400458585508|13114041.4984283|91.5773|98.7388|106.926|114.645
The values for polygons 1 and 2 are strictly identical. Overlapping areas are thus correctly taken into account.
To test even further, I ran
v.extract -d test cat=3 out=test3
to get the entire polygon with cat=3.
Then
v.rast.stats test3 rast=elevation colprefix=e -c
> v.db.select test3
cat|id|e_number|e_minimum|e_maximum|e_range|e_average|e_stddev|e_variance|e_coeff_var|e_sum|e_first_quartile|e_median|e_third_quartile|e_percentile_90
3|3|224074|71.4758224487305|141.793502807617|70.3176803588867|110.21428988784|13.2281044492473|174.982747320197|12.0021681968|24696156.7923279|100.265|110.004|120.916|127.836
There thus seems to be a bug in v.rast.stats as it does not calculate the correct values for the polygon with cat=3 when there area polygons with multiple cat values. Running v.to.db with op=area on test3 I get an area that corresponds to the number of pixels identified in test3, i.e. 224074.
When I run
v.overlay ain=test3 bin=test_nooverlap op=not out=t3_no1_2
v.to.db -p t3_no1_2 op=area
I get an area that corresponds to the number of pixels identified for polygon 3 in test, i.e. 99039. v.rast.stats thus only takes into account the non-overlapped part of polygon 3.
Change History (12)
by , 8 years ago
| Attachment: | example_overlapping_polygons.png added |
|---|
by , 8 years ago
comment:1 by , 8 years ago
comment:2 by , 8 years ago
| Milestone: | 7.2.1 → 7.2.2 |
|---|
comment:5 by , 7 years ago
| Milestone: | → 7.2.4 |
|---|
comment:6 by , 6 years ago
| Milestone: | 7.2.4 → 7.8.0 |
|---|
comment:10 by , 5 years ago
| Milestone: | → 7.8.3 |
|---|
The issue obviously comes from the internal use of v.to.rast to transform the vector polygon map to a raster map which then can be used as zonal map input to r.univar. v.to.rast uses the first category value of the polygons as pixel value for the output raster map.
A possible path towards a solution to this problem might be to check whether polygons with multiple categories exist, and if that is the case, to create a new layer in the polygon file with a unique cat value for each polygon. Then run v.to.rast on that layer and r.univar. Load the results of r.univar as a table linked to the new layer with unique cat value, and then use some SQL magic / v.to.db to create an association table between the cat values in the original layer of the polygon map and the cat values in the new layer be able to calculate aggregate values for each cat in the original layer.
Just ideas, but no time to work on that at this stage...