Proposal title
| Date | 2009/04/20 |
| Contact(s) | nicolas, francois |
| Last edited | Timestamp |
| Status | being discussed |
| Assigned to release | 2.5.0 |
| Resources | Done in geocat.ch sandbox |
Overview
Log all search made on the catalogue. Create an analyzer for the logged information and add an administration view for the analyzer results.
...
Proposal Type
- Type: GUI Change, New module
- App: GeoNetwork
- Module: Lucene searcher
Links
- Documents:
- Email discussions:
- Other wiki discussions:
Voting History
- Vote proposed by X on Y, result was +/-n (m non-voting members).
Motivations
Improve catalogue usage for the administrator.

Proposal
To be logged:
- search criteria
- criteria values
- user IP
- metadata view (done using popularity in GeoNetwork)
Where to log :
- in all searchers : Lucene searcher, Z39.50 searcher and CatalogueSearcher
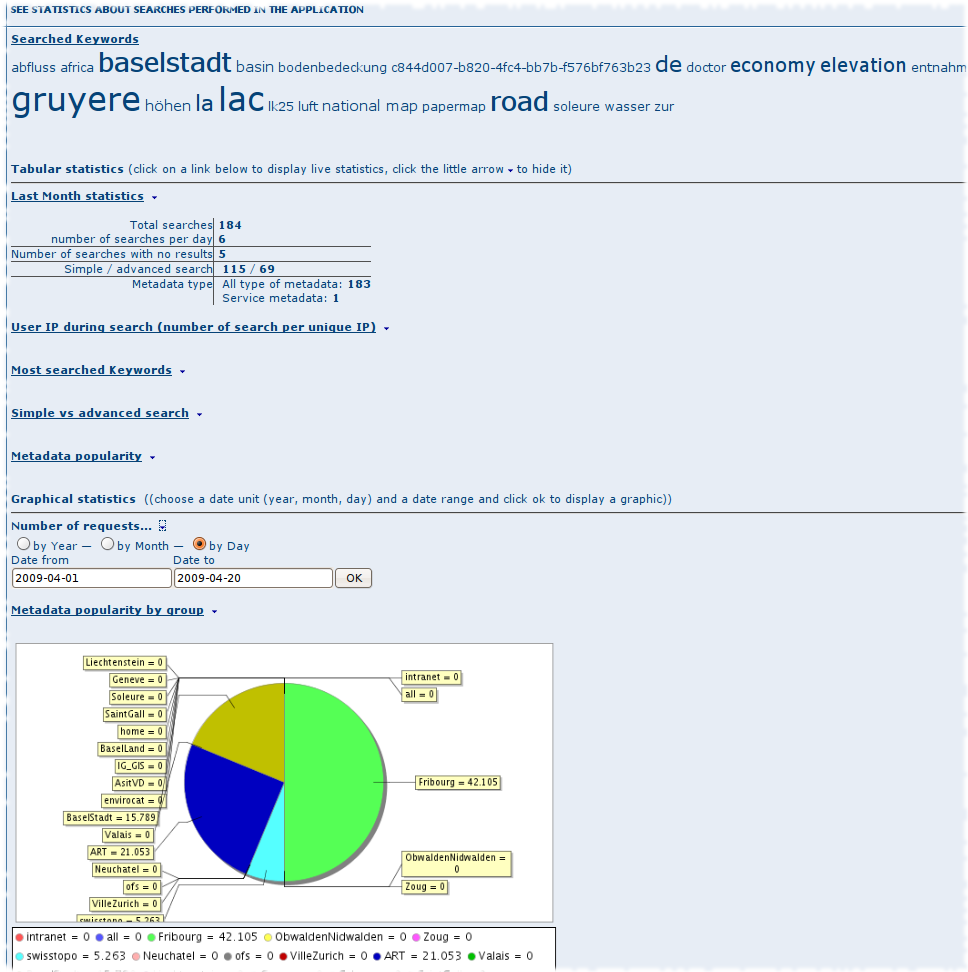
Indicators:
- more used criteria (top 10)
- more used values (top 10)
- groups selected
- type of metadata
- spatial search or not
- simple search (ie full text) or advanced
- number of results by search (average, 0)
- metadata popularity and popularity by group
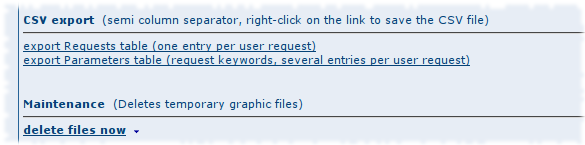
Reports:
- HTML format
- Charts for number of search by days
- tagclouds view
- tables
- text file export

...
Backwards Compatibility Issues
Risks
Participants
- Nicolas (main actor)
- Francois (support)
Specifications (current implementation of statistics)
Storing and displaying information about metadata search involves several sub components or logical elements:
- The Database schema that will store search information
- The Jeeves services that will be impacted by the statistics registration
- The configuration part in which the kind of information to present is configured (to be precised, too vague for me)
- The Graphic rendering to display charts
- The HTML output to present result tables
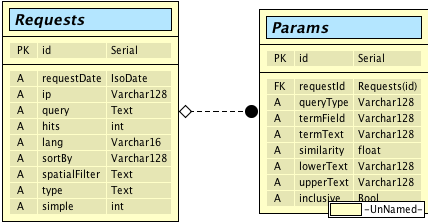
Database schema
Geonetwork already uses a database to store configuration information. This schema is extended to add tables that will store search criteria. The DB schema is shown on the following picture:

Druid is used to define the tables that will store search criteria.
Database access is done 2 times during the statistics lifecyle:
- When a lucene query is performed, Requests and Params objects are created from the current context and the Lucene search terms (Params). These objects are store into the dabase.
- When the statistics are used in the GN, administration page: each time a statistic is displayed, a query is made in the database to get results.
Configuration/administration
The configuration of statistics can be made at the Jeeves service level: by editing the config_statistics.xml, one can change the queries used to generate stat report (when doing this, also change the XLST sheets corresponding to the service to be sure attribute names are consistent whith those returns by SQL queries.
The Graphics service can also receive HTTP parameters sent when calling the service (image size for instance). One could add an "advanced" tab to the stats page to allow administrator to set these parameters.
Jeeves services
2 kind of services are created to deal with statistics:
- pure XML services, where the SQL query to get stats is sent by a Jeeves service. result is processed by a dedicated XSLT sheet.
- Java service, when a specific processing is to be done before presenting the result:
Such services are defined to set the graphic (date range, graphic properties, graphic file writing), or to deal with SQL results
Graphic Rendering
JFreeChart lib is used to produce graphics. Graphic type (pie chart, temporal serie) is hard-coded in the Java service. An image file is written on the server (web/images/statistics) and its URL is sent to the XSLT sheet.
An optional ImageMap HTML information can be returned by the service, allowing tooltips on the graphic image.
The UI part allow to define the time range and stat type (Daily, monthly or yearly)
A caching mechanism is used to use already-generated images.
HTML output
The statistics page contains links to stat services. Their results are injected into the page (ajax call).
Tagcloud feature:
A JS method is used to generate a lightweight tagcloud based on a SQL query counting search results group by keywords. This tag is currently displayed at the beginning of the page.
Improvements - genericity
- Database management:
- add a thread to perform database insertion when a search is done, to avoid slowing down the search process
- Chart generation:
- add a configuration mechanism to choose JFreeChart graphic type, colors, legend display/position
- HTML/GUI:
- add link to tagcloud terms, replaying the search for the clicked term
- Administration/configuration:
- Group all configuration options in the same place. currently, statistics configuration can be found in the XML file defining the services (config-stats.xml), in the database itself (config table, storing if the search log mechanism is enabled or disabled) and in a xml file passed with one service (MD popularity).
- Thinking about changing all statistics services to Java classes, to allow passing specific configuration parameters
Attachments (3)
- gn_stats_db_schema.png (17.1 KB ) - added by 16 years ago.
- admin-statistical-view2.png (17.6 KB ) - added by 16 years ago.
- admin-statistical-view3.png (132.3 KB ) - added by 16 years ago.
Download all attachments as: .zip