| Version 28 (modified by , 7 years ago) ( diff ) |
|---|
Final Report: Implement Geospatial Data Viewer in pgAdmin4 for PostGIG 
- Title: Implement Geospatial Data Viewer in pgAdmin4 for PostGIS
- Organization: OSGeo
- Mentors: Victoria Rautenbach and Frikan Erwee
- Student: Xuri Gong, Peking University
- GSoC Proposal: Proposal for GSoC 2018.pdf
- Repository: https://github.com/Gooong/pgadmin4/tree/geoviewer
- Code Patch: geometry_viewer.patch
- Pull Request: Code patch has been sent
Status Before GSoC 
pgAdmin is the GUI management tool for PostgreSQL. The latest version pgAdmin4 is web-based and written in Python and jQuery with Bootstrap, using the Flask framework. But currently there is no geospatial data viewer in pgAdmin4-3.1, and external applications, such as QGIS are required if we want to browser the data in a map. It’s not convenient for users to view geometries directly in pgAdmin4 “Data Output” table panel.
My Proposal And Work. 
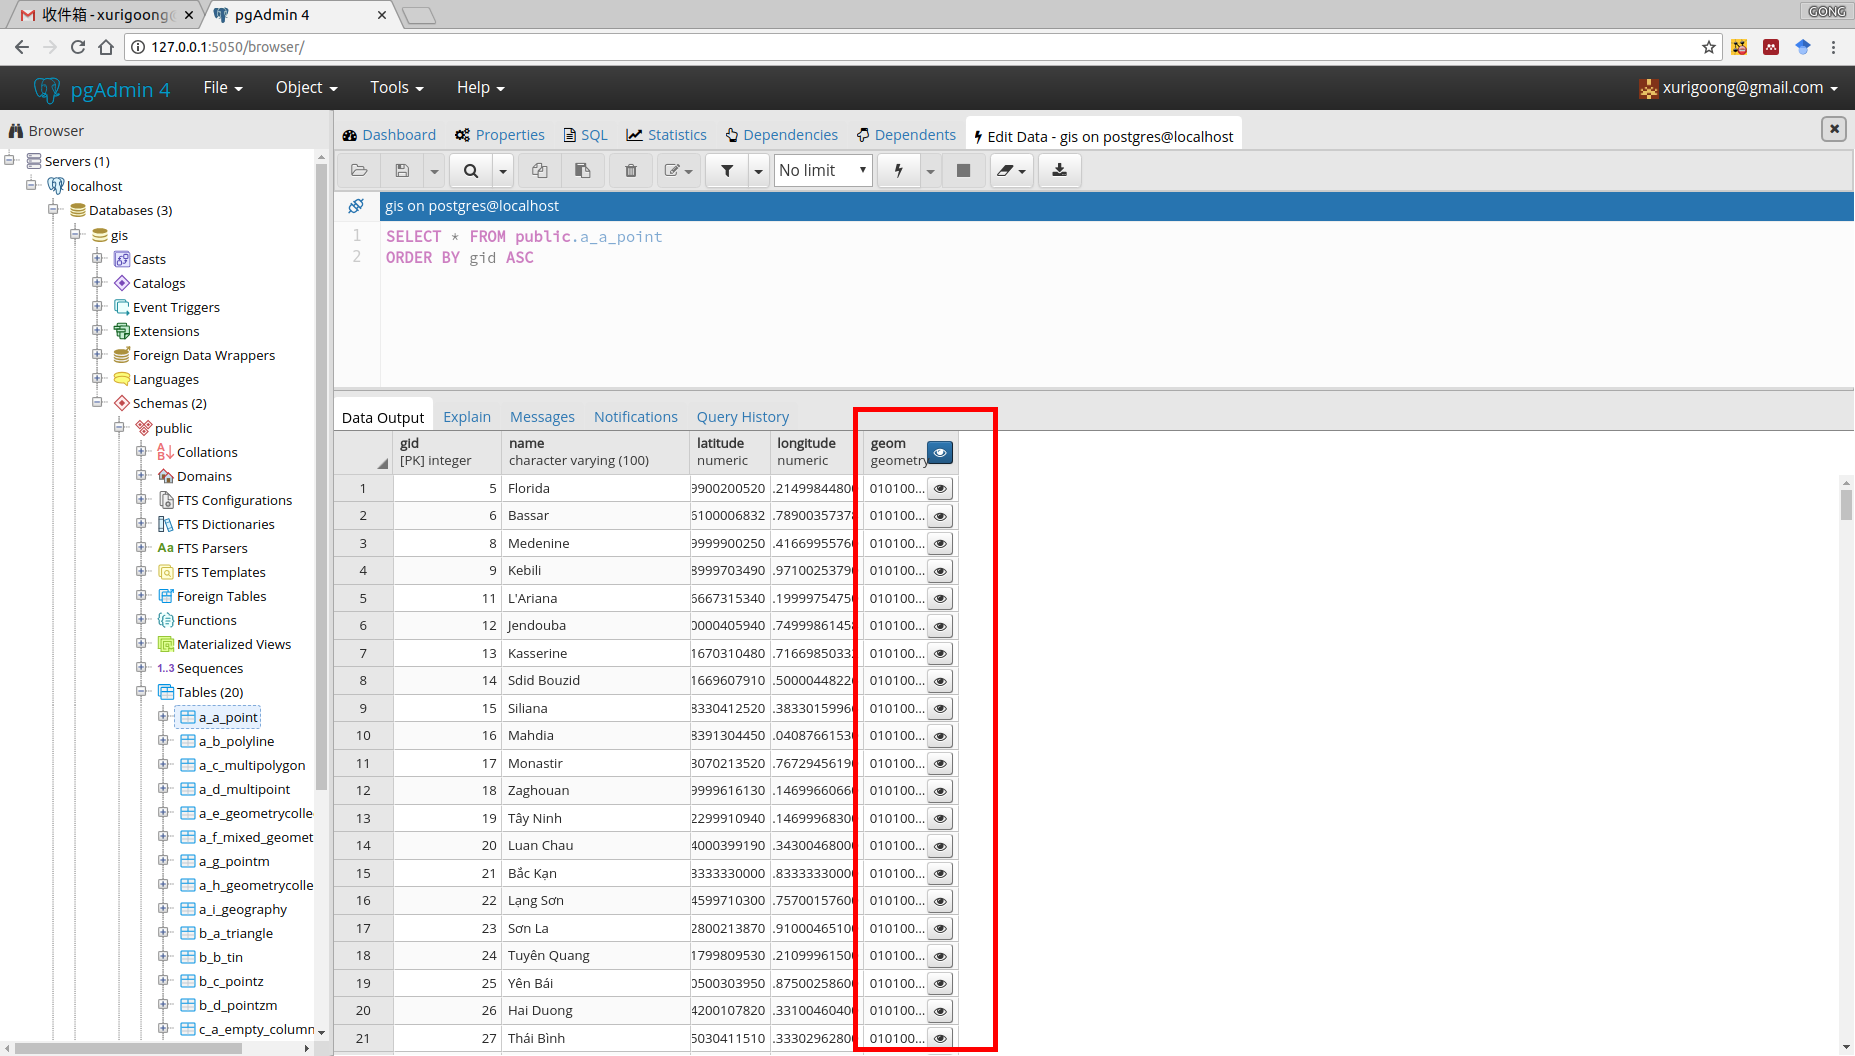
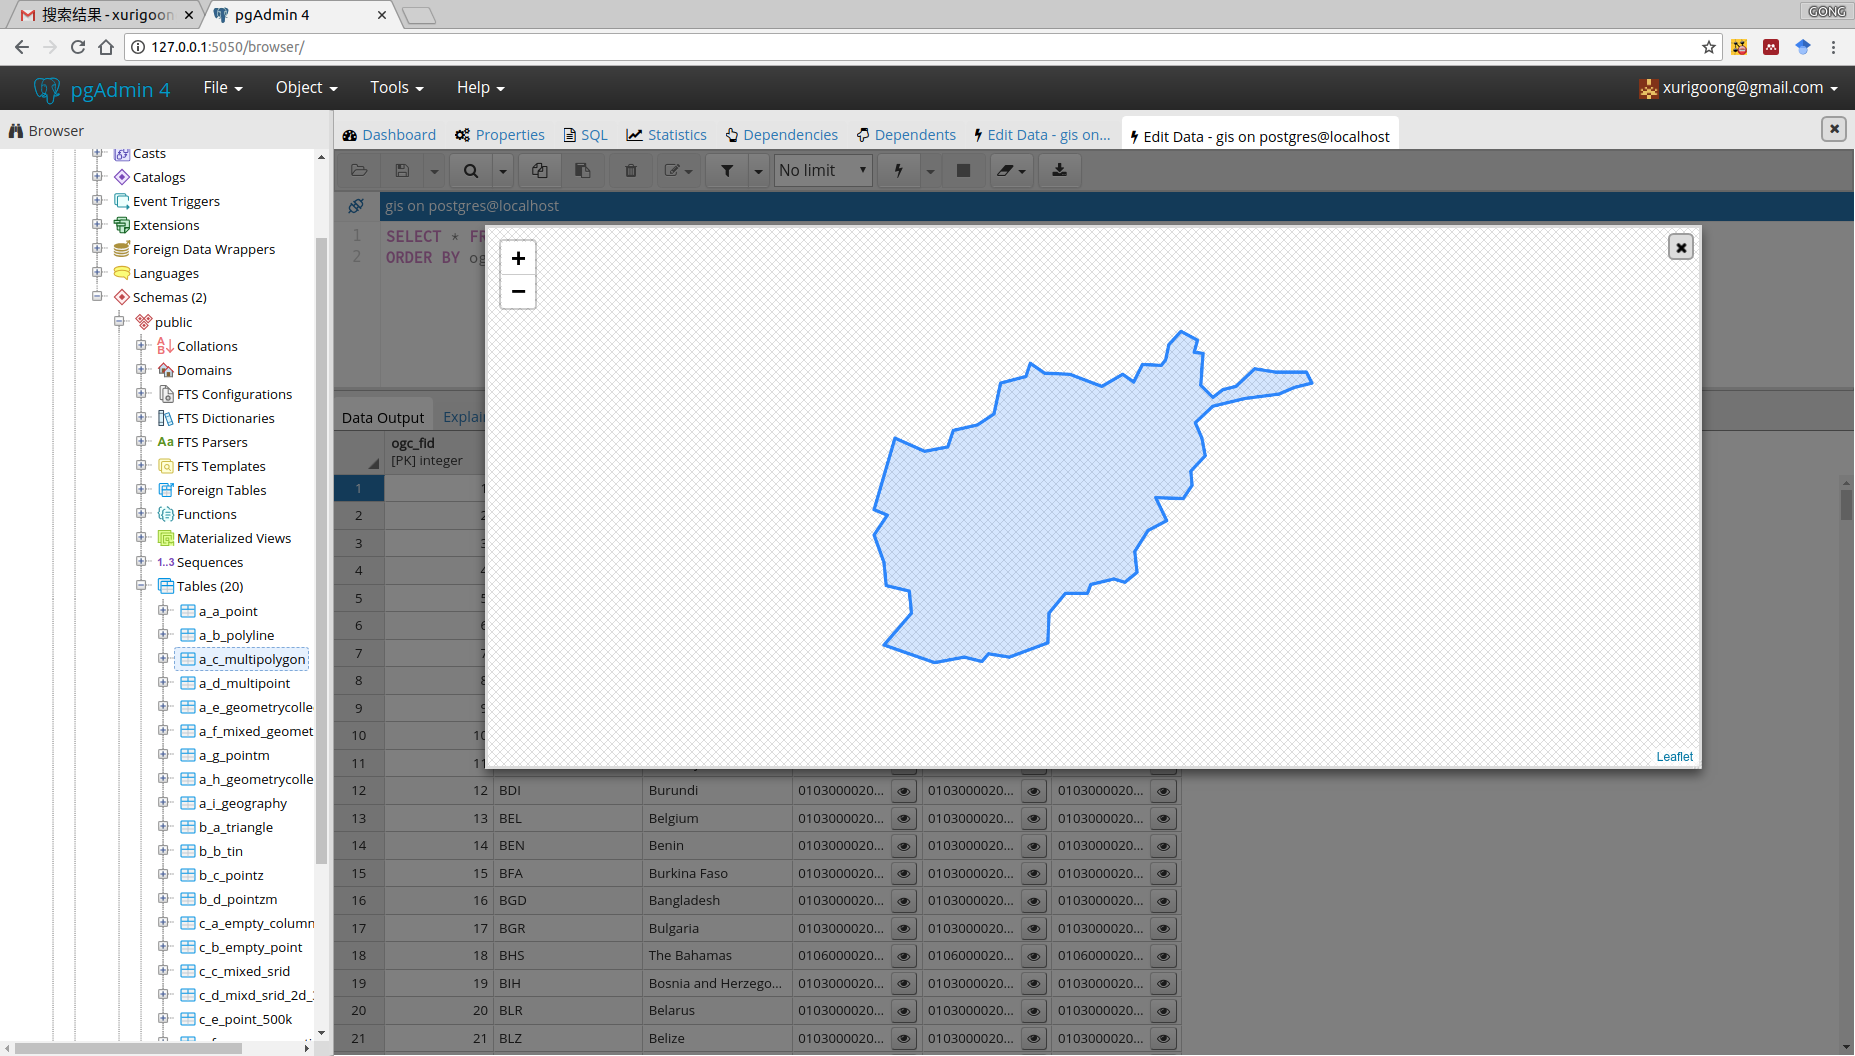
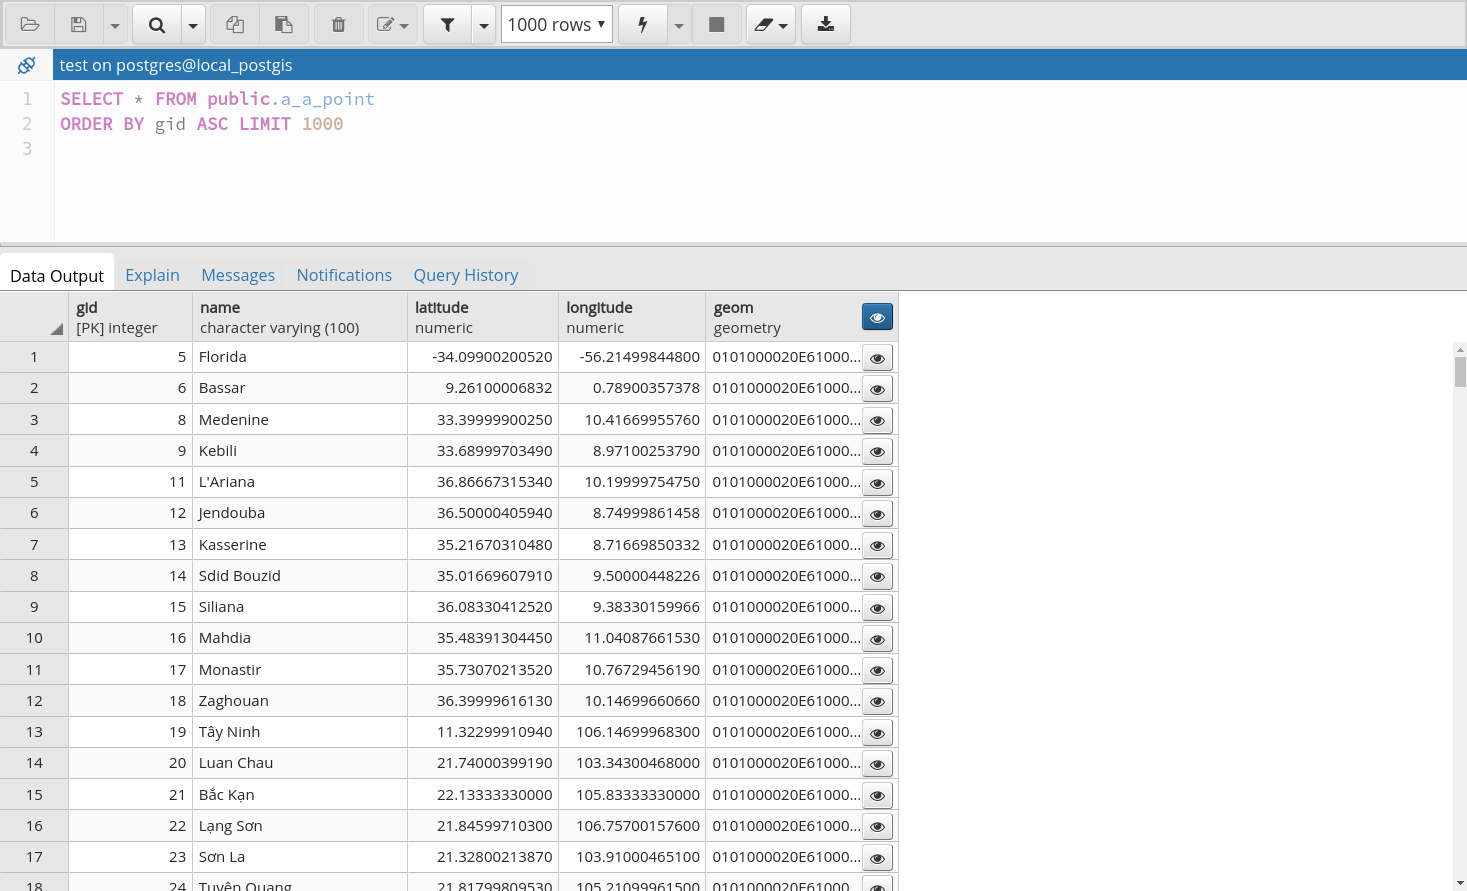
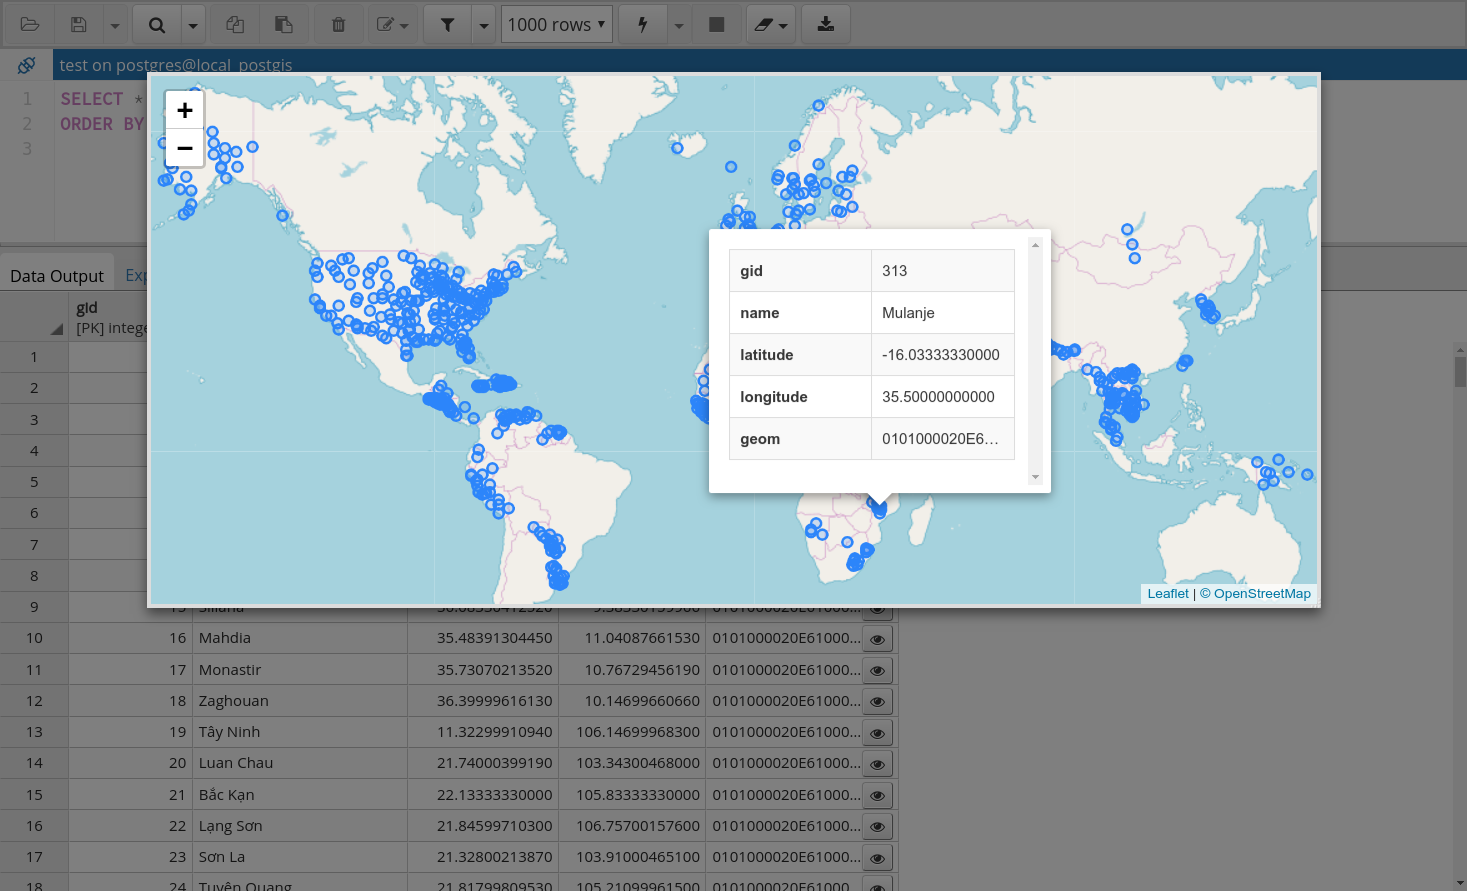
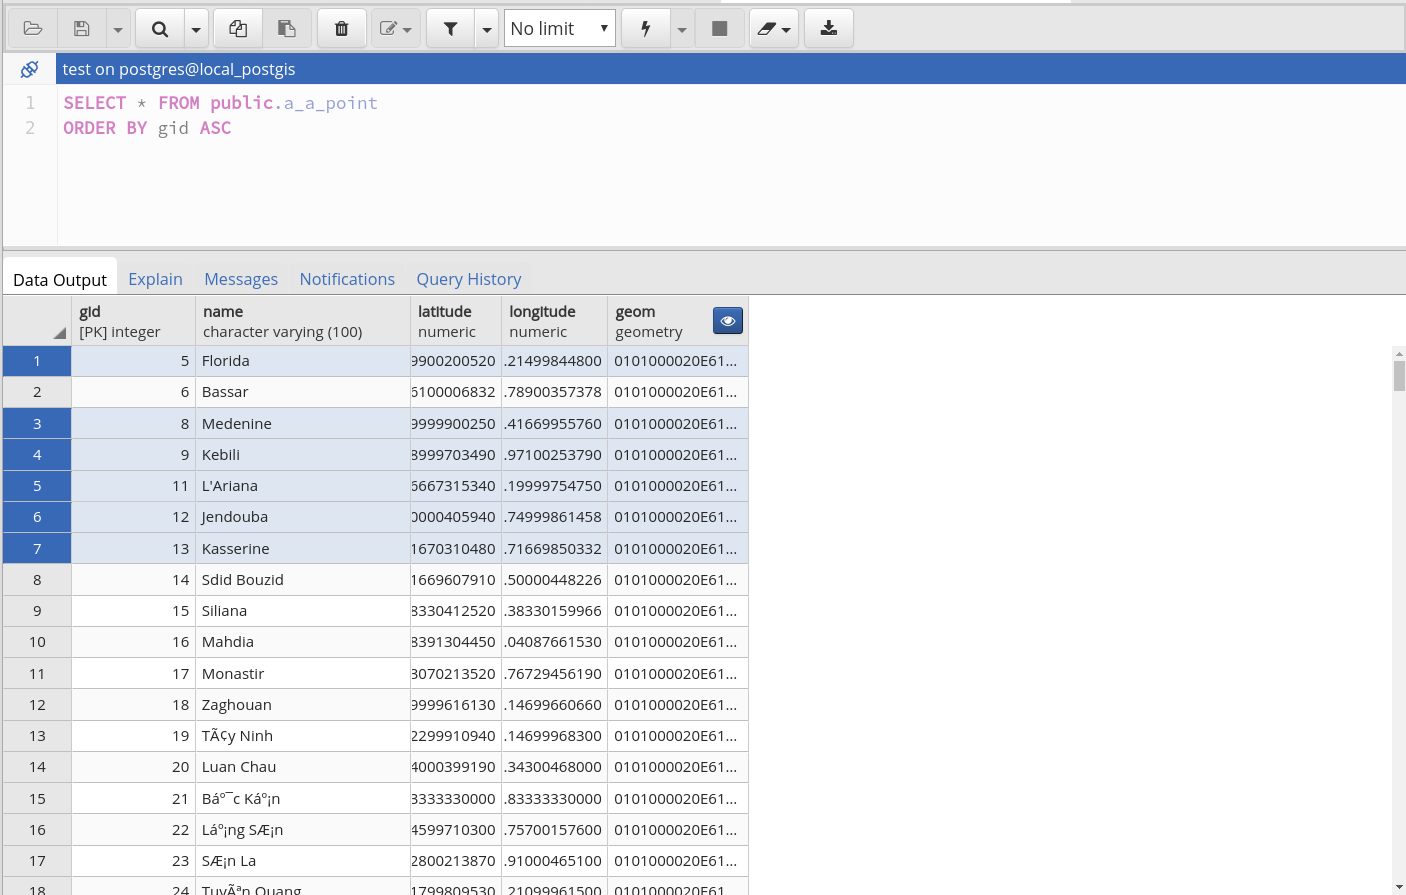
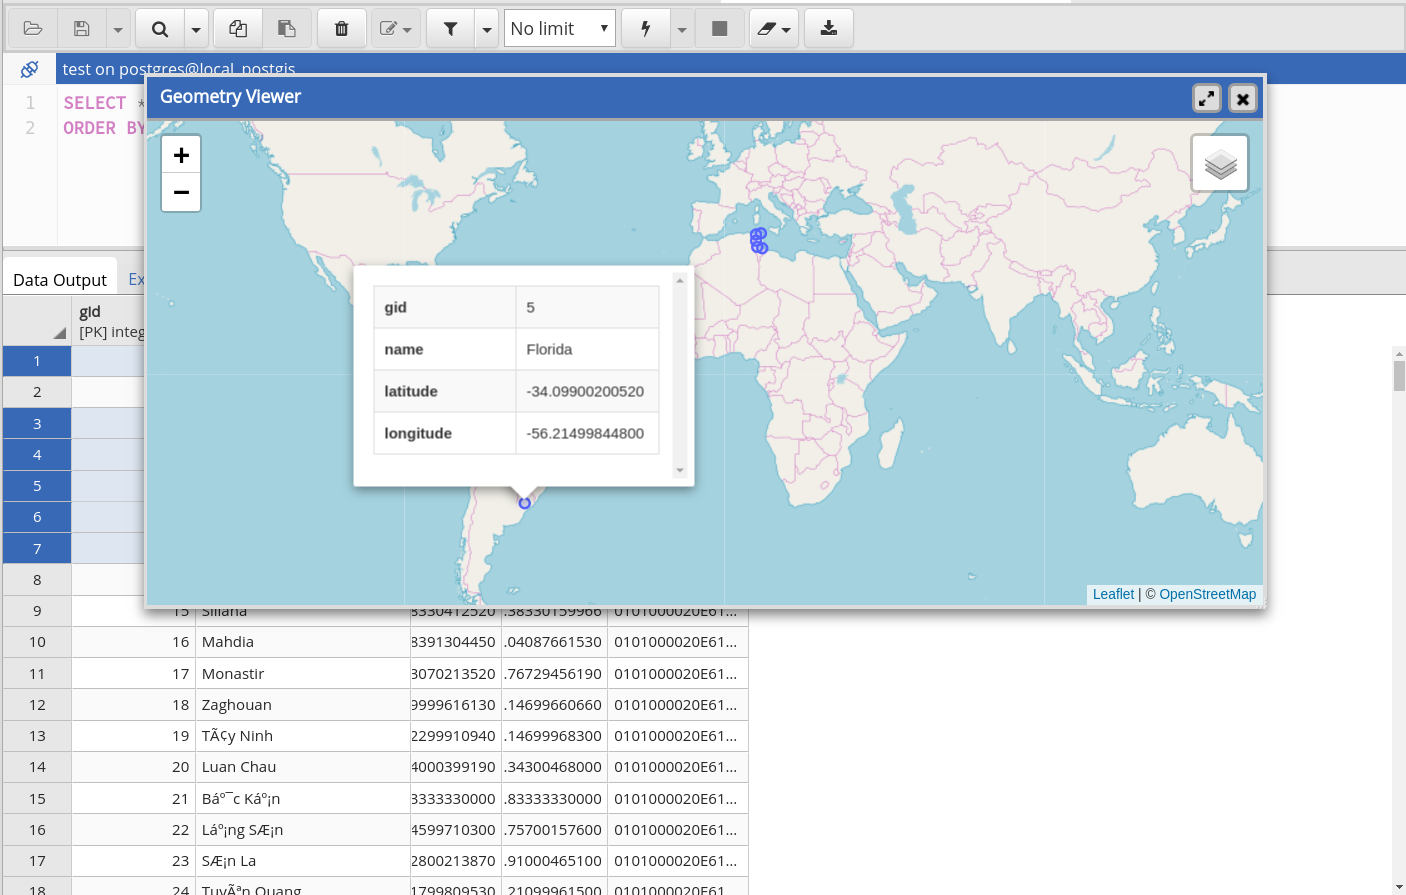
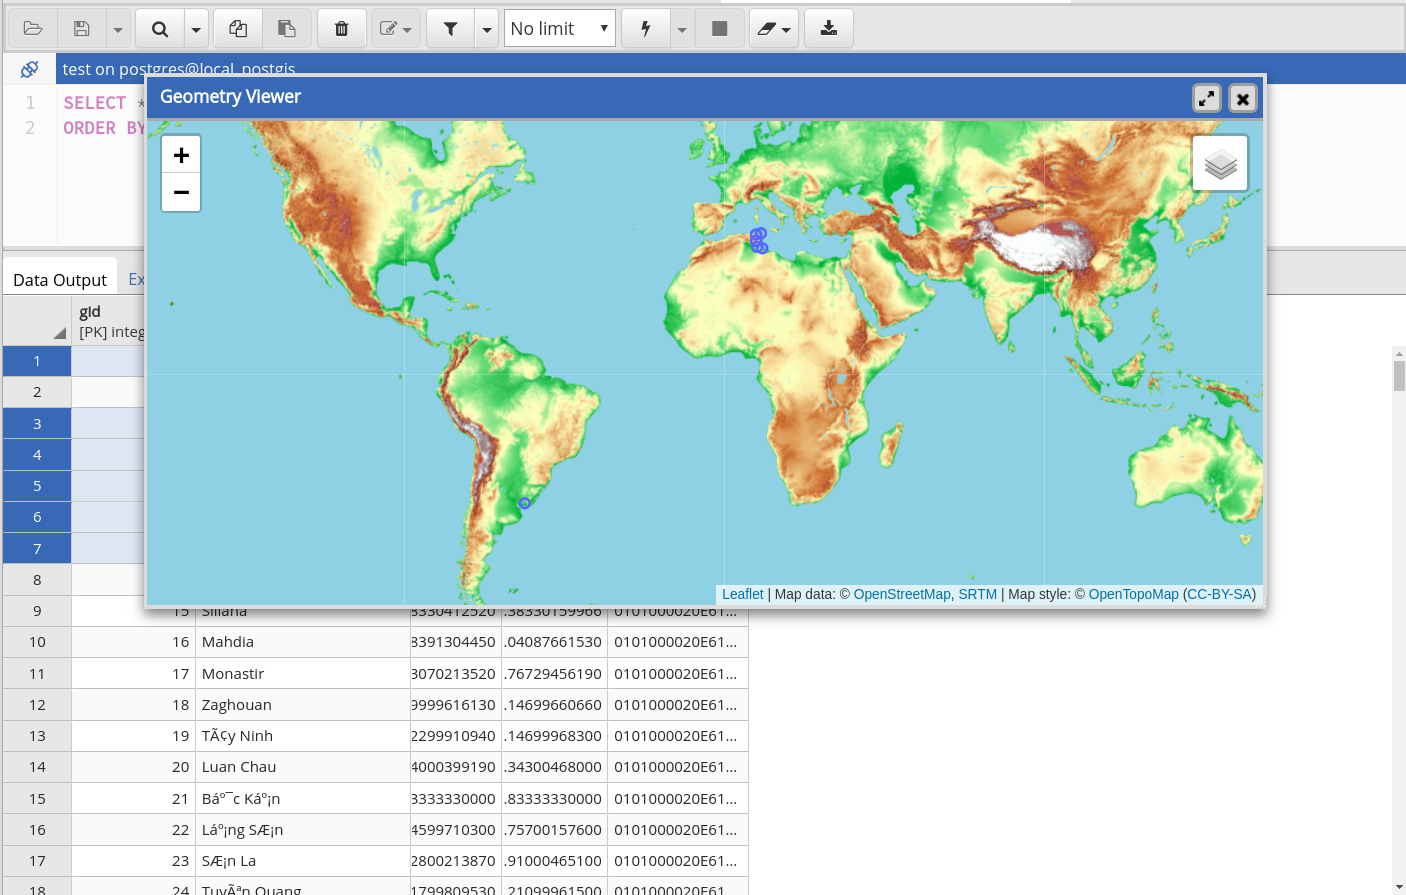
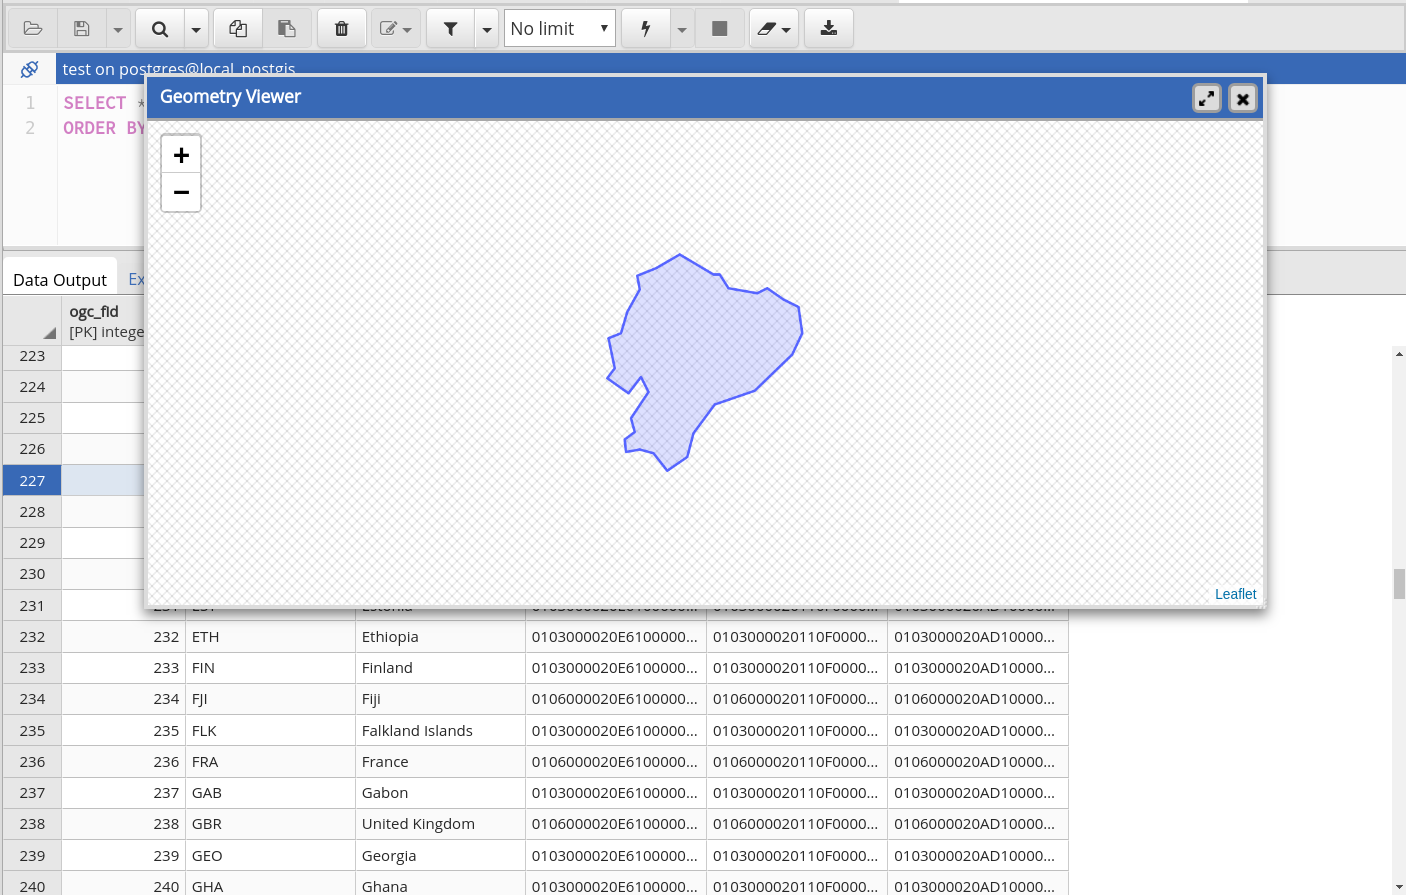
I propose to implement a geospatial data viewer in pgAdmin4 that will allow users to view the tables in a spatial database and the results of queries executed. With the viewer I intend to develop, users can directly view geospatial data on a map within the pgAdmin4 GUI.
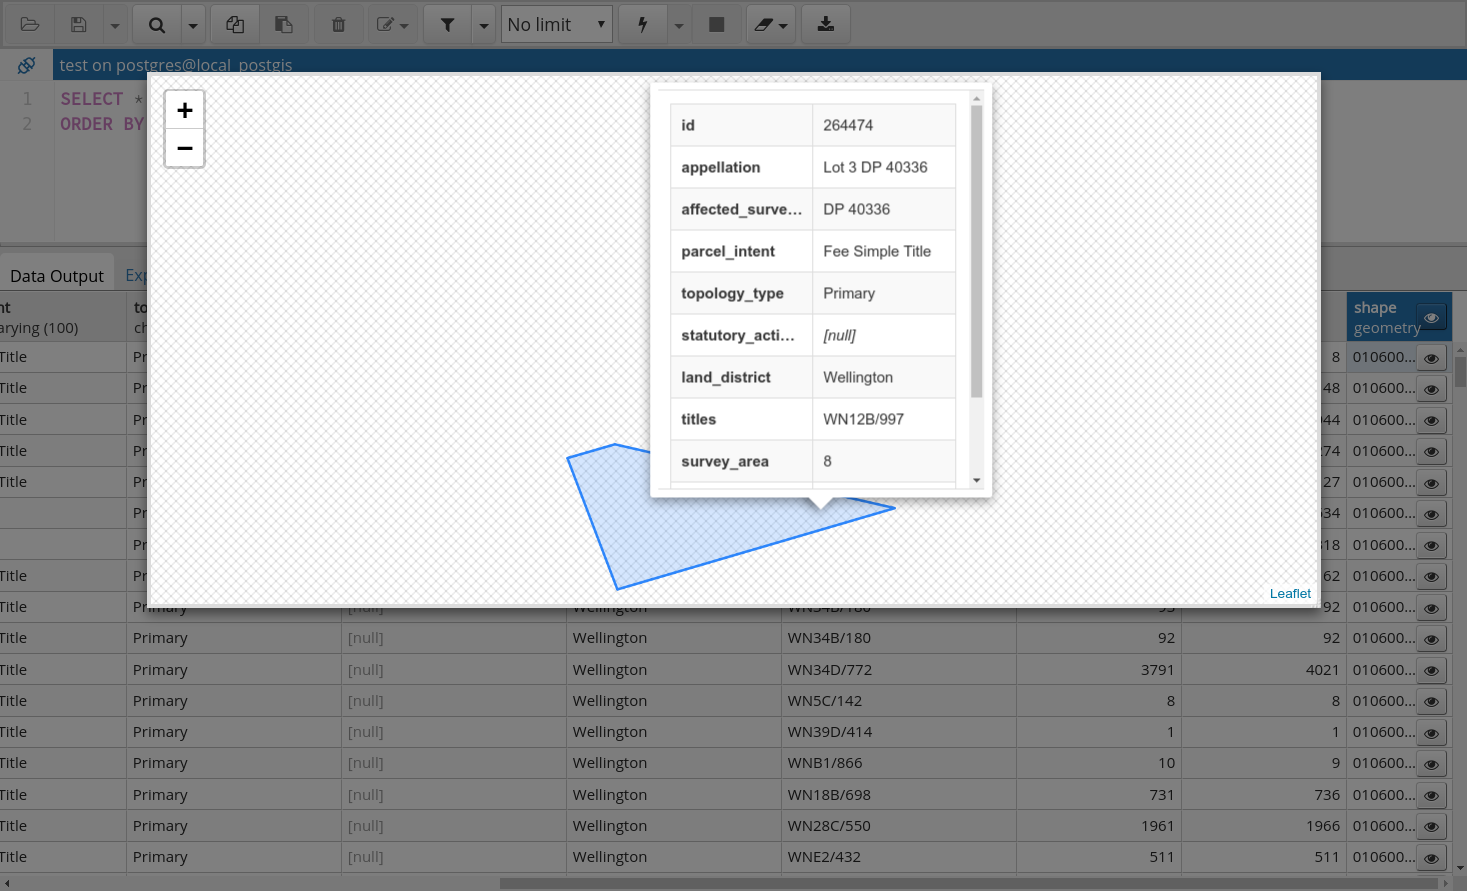
With the geometry viewer I have created, now users can view individual geometry and the whole output geometries in the map. They can also view the properties directly by clicking the geometry. Here are some screenshots:


Test 
Please test my code following instructions here:
- Clone the geoviewer branch.
- Build and run pgAdmin4 following README.md in the repository.
- For unit test
cd $PGADMIN4_SRCand runmake check-js. - If you want to have a try or test manually, install PostGIS and import some geometry data (for example import this database using psql). Then execute query in the pgAdmin4 and view the results.
Future Work 
- Optimize performance:
- Cluster markers using Leaflet.markercluster.
- Enable vectortile layer using geojson-vt. Here is an example: leaflet-and-geojson-tiles.
- PgAdmin4 only load 1000 records by default. When users click 'view' button in the column header, show the map firstly and load the other records in the background and then add the records dynamically.
- New features:
- Custom geometry style, e.g
SELECT *, '#333333' as __fillcolor, '#232323' as __strokecolor, 0.5 as __strokewidth FROM xxx. - Custom background tile layer. Enable users to select different tile layers and specify their own layer url.
- Highlight selected feature. Add 'zoom home extent' button. Remove the geometry column from the feature pop-up box.
- Custom geometry style, e.g
Attachments (13)
- screenshot_1.png (254.1 KB ) - added by 7 years ago.
- screenshot_2.png (227.6 KB ) - added by 7 years ago.
- screenshot_3.png (463.5 KB ) - added by 7 years ago.
- screen_1.png (154.9 KB ) - added by 7 years ago.
- screen_2.png (170.0 KB ) - added by 7 years ago.
- screen_3.png (280.0 KB ) - added by 7 years ago.
- screen_4.png (261.9 KB ) - added by 7 years ago.
- geometry_viewer.patch (114.9 KB ) - added by 7 years ago.
- Selection_013.png (134.5 KB ) - added by 7 years ago.
- Selection_014.png (221.1 KB ) - added by 7 years ago.
- Selection_015.png (439.0 KB ) - added by 7 years ago.
- Selection_016.png (116.8 KB ) - added by 7 years ago.
- Peek 2018-08-16 00-13.gif (2.8 MB ) - added by 7 years ago.