| Version 65 (modified by , 7 years ago) ( diff ) |
|---|
Implement Geospatial Data Viewer in pgAdmin4 for PostGIS 
- Title: Implement Geospatial Data Viewer in pgAdmin4 for PostGIS
- Organization: OSGeo
- Mentors: Victoria Rautenbach and Frikan Erwee
- Student: Xuri Gong, Peking University
- GSoC Proposal: Proposal for GSoC 2018.pdf
- Repository: https://github.com/Gooong/pgadmin4
Abstract 
pgAdmin is the GUI management tool for PostgreSQL. The latest version pgAdmin4 is web-based and written in Python and jQuery with Bootstrap, using the Flask framework. But currently there is no geospatial data viewer in pgAdmin4, and external applications, such as QGIS are required if we want to browser the data in a map. It’s not convenient for users to view geometries directly in pgAdmin4 “Data Output” table panel.
I propose to implement a geospatial data viewer in pgAdmin4 that will allow users to view the tables in a spatial database and the results of queries executed. With the viewer I intend to develop, users can directly view geospatial data on a map within the pgAdmin4 GUI.
Weekly Reports: 
- Community Bonding Period (April 24 - May 13)
- Week 1 (May 14 - 20)
- Week 2 (May 21 - 27)
- Week 3 (May 28 - June 3)
- Week 4 (June 4 - 10)
- Week 5 (June 11 - 17)
- Week 6 (June 18 - 24)
- Week 7 (June 25 - July 1)
- Week 8 (July 2 - 8)
- Week 9 (July 9 - 15)
- Week 10 (July 16 - 22)
- Week 11(July 23 - 29)
- Week 12(July 30 - August 5)
- Final Report
Community Bonding Period (April 24 - May 13) 
- Set up dev environment and my wiki page for TODO list and weekly report.
- Introduce myself and this project in pgAdmin4, PostGIS and SoC mailing list.
- Discuss with mentors about the implementation plan. Here is the draft of my technical notes: GSoC Technical notes
- Remain constant touch with my mentors using Google Hangouts. Set up user requirements and discuss the design details with mentors. Settle the final design according to user requirements and feasibility. Here is the design document: pgAdmin4 Geo Viewer Design Document
- Get deeper into pgAdmin4 source code and learn more about require.js lib.
Week 1 (May 14 - 20) 
Create web UI for viewing map[part one]: Add the "map view" panel in pgadmin4 sqleditor.
Week 2 (May 21 - 27) 
Create web UI for viewing map[part two]: Add layout and openlayers map in the "map view" panel.
Week 3 (May 28 - June 3) 
Implement parse_geo_data function to parse the query result data.
Week 4 (June 4 - 10) 
Add openlayers map and render the parsed result data in the map.
Week 5 (June 11 - 17) 
Add function to group geometries with the same srid and render the group with max geometry number. Related discussion can be found here.
This is the code commit link in my repository. I have also updated the design document for this function.
Week 6 (June 18 - 24) 
What did you get done this period?
- Add column option for the viewer. For query result with more than one geometry type column, the viewer will offer column option for user to choose which column to show in the map.
- Create map_view_column_option.jsx and map_view_column_info.jsx file for the column option. See commit add column option for the viewer
What do you plan on doing next week?
- Optimize the column option.
- Implement geometry selection functionality.
Week 7 (June 25 - July 1) 
What did you get done this period?
- Handle resize event to resize the map when the panel size change: https://github.com/Gooong/pgadmin4/commit/d1f8de0a693790801034773ad376341e64ab0767
- Fix bug and add css for column option: https://github.com/Gooong/pgadmin4/commit/df49476b2cbc3e3e0d3da5f2dff18b9f2d72e36c
Now the viewer can handle multi geo columns data and mixed srids in one column, here is the screen shot:
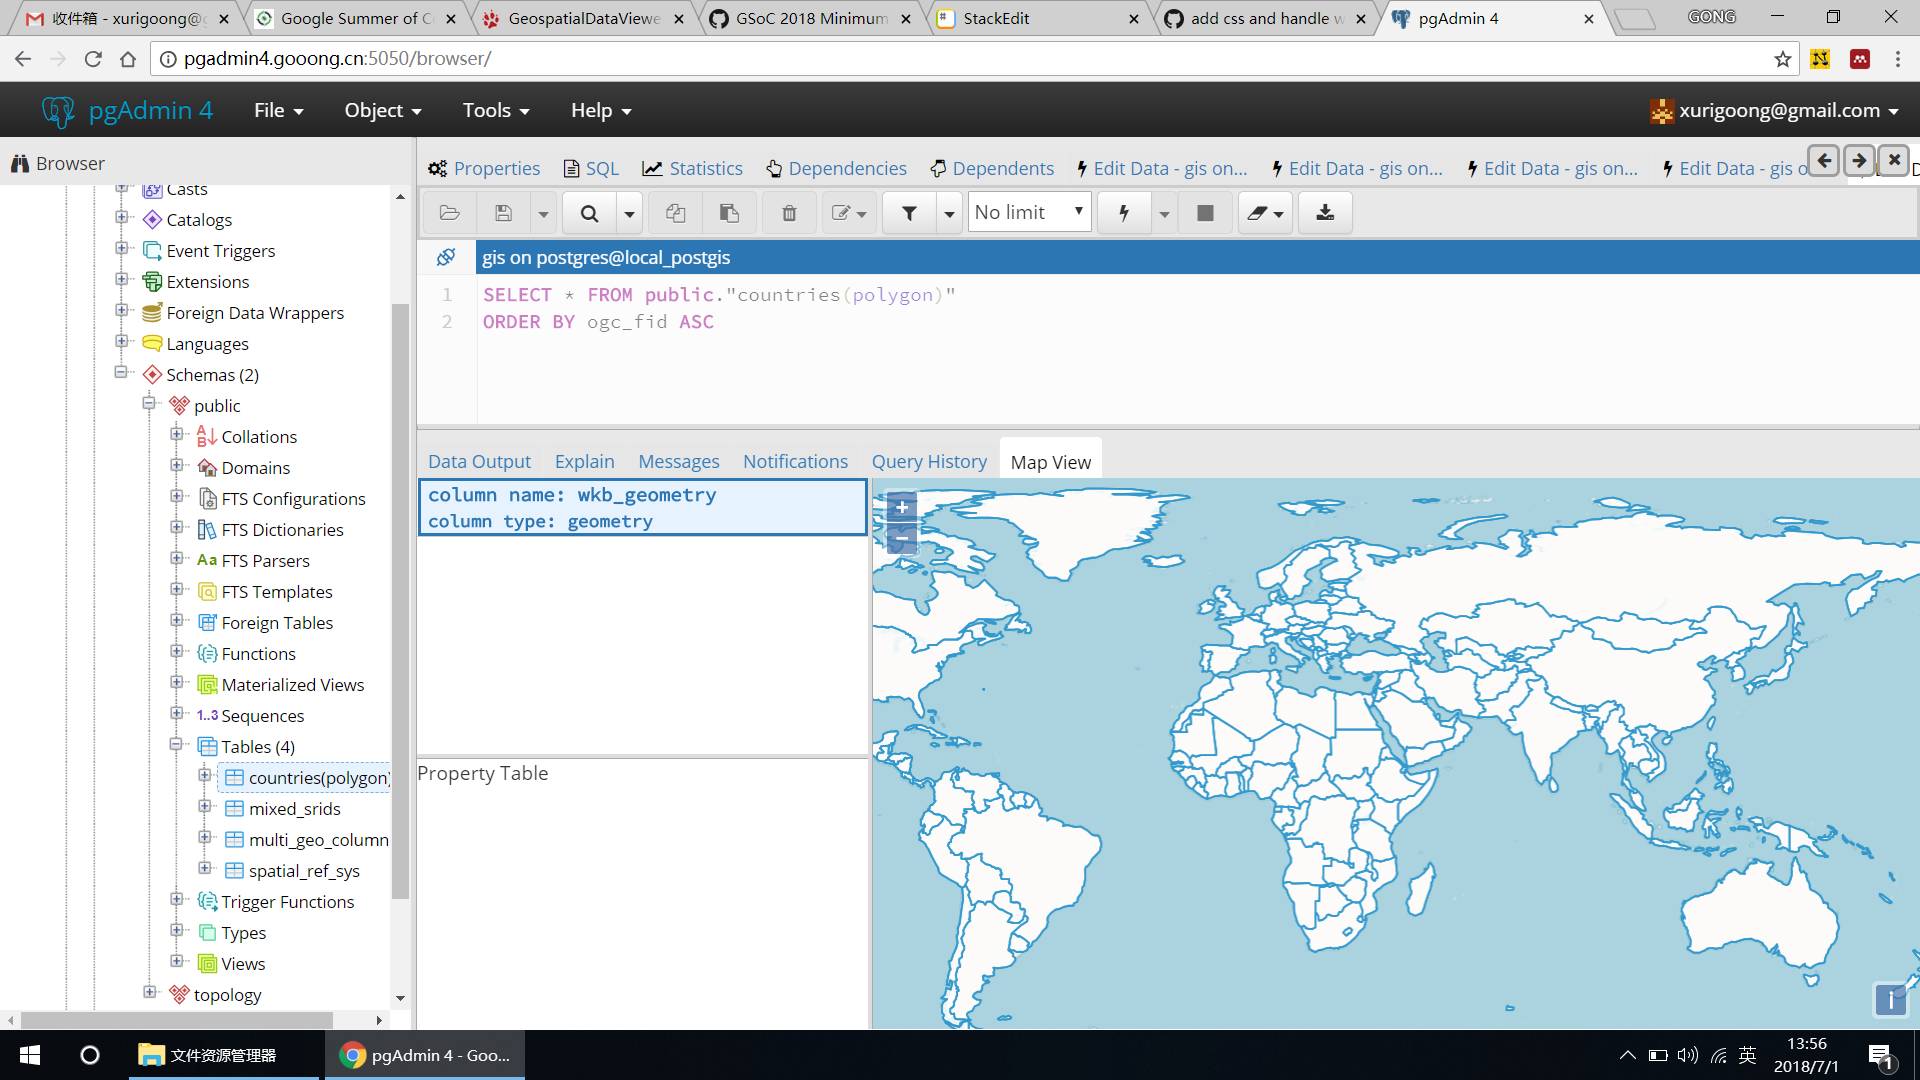
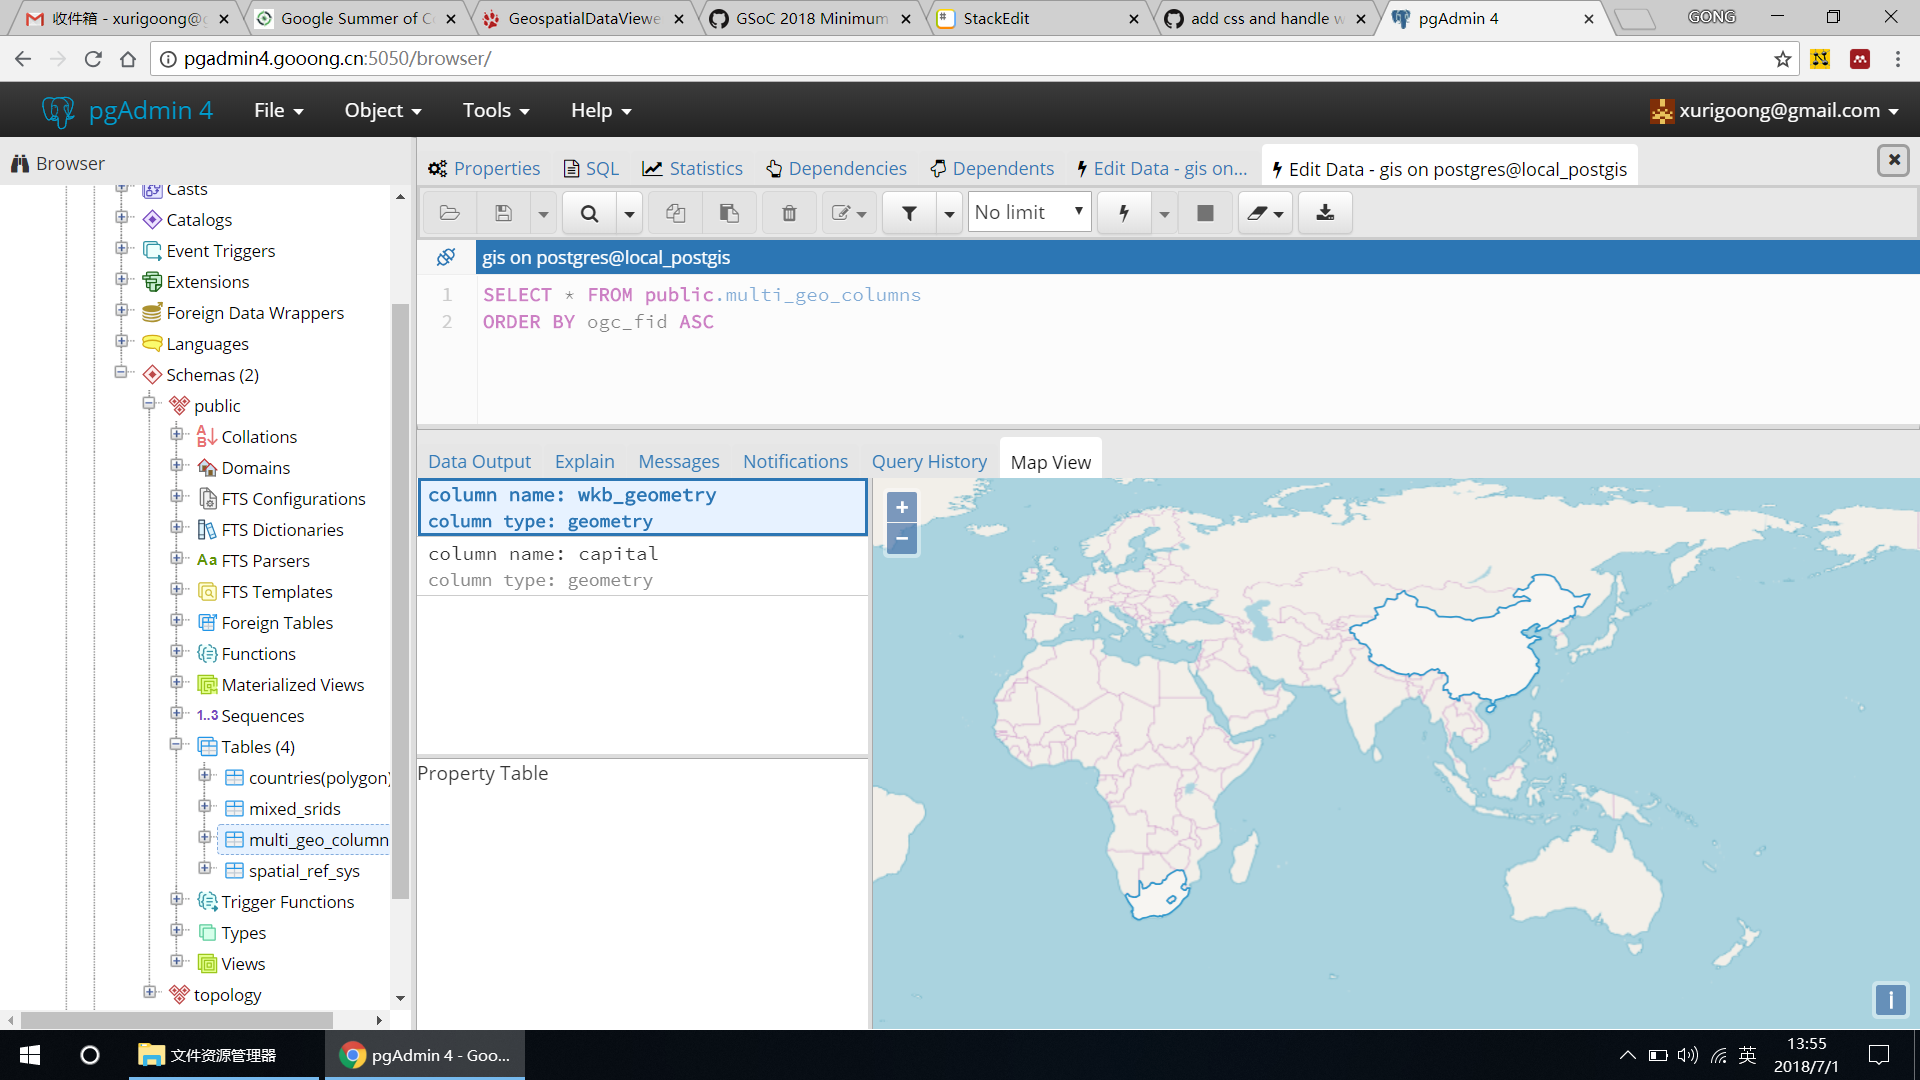
What do you plan on doing next week?
- It will still throw many warnings when importing openlayers lib, I will ask for help in the pgadmin community.
- Continue implementing geometry selection functionality mentioned in the design document 4.3.
Week 8 (July 2 - 8) 
What did you get done this period?
- Implementing geometry selection functionality mentioned in the design document 4.3: https://github.com/Gooong/pgadmin4/commit/d135255a7523a2da3f22e73bfb32375b63e07852
- Change the vector render mode to "image" to improve performance: https://github.com/Gooong/pgadmin4/commit/d135255a7523a2da3f22e73bfb32375b63e07852
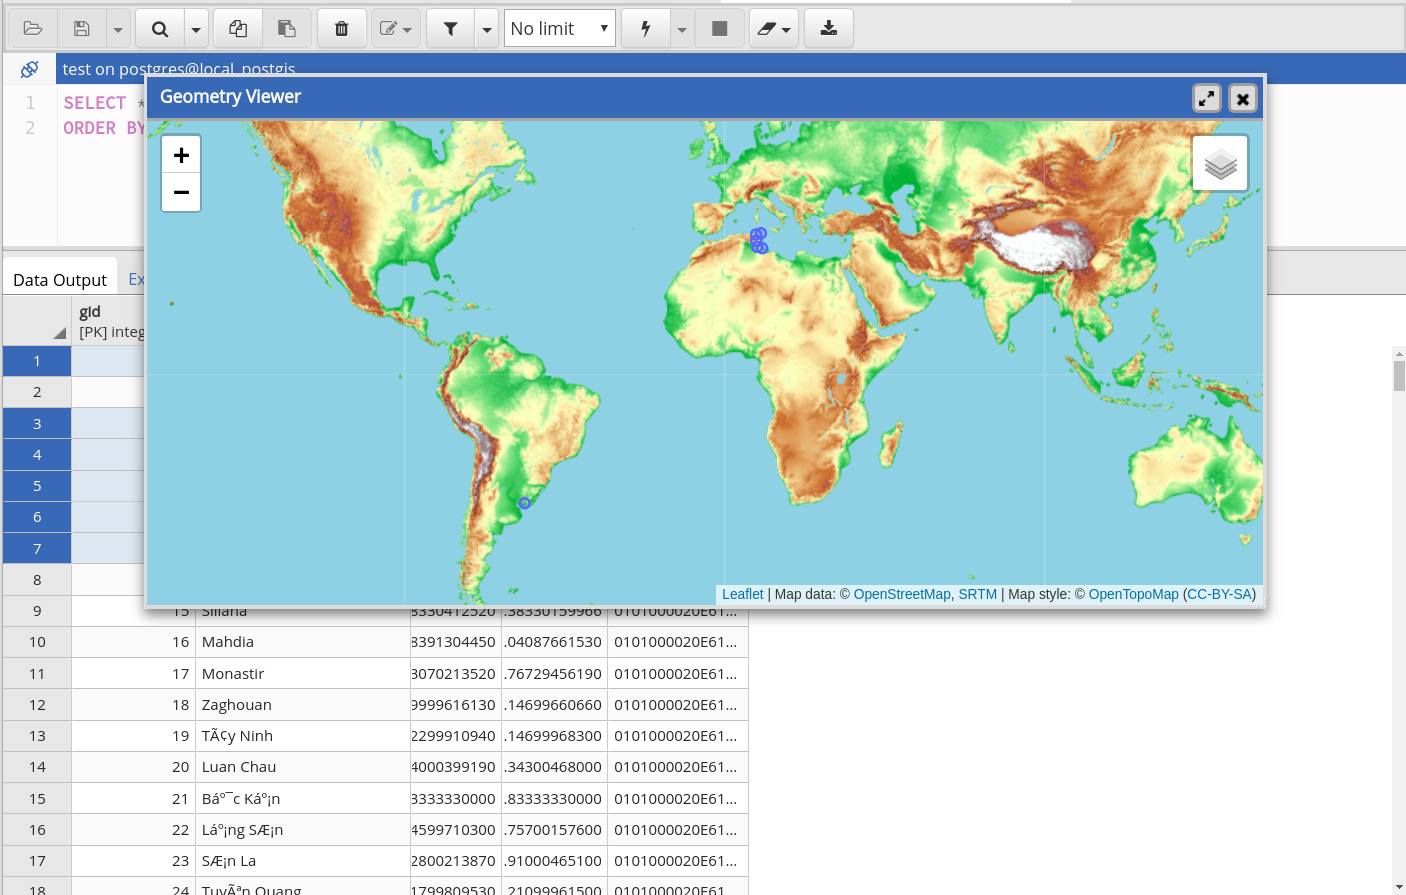
Now the viewer support geometry selection functionality, here is the screen shot:
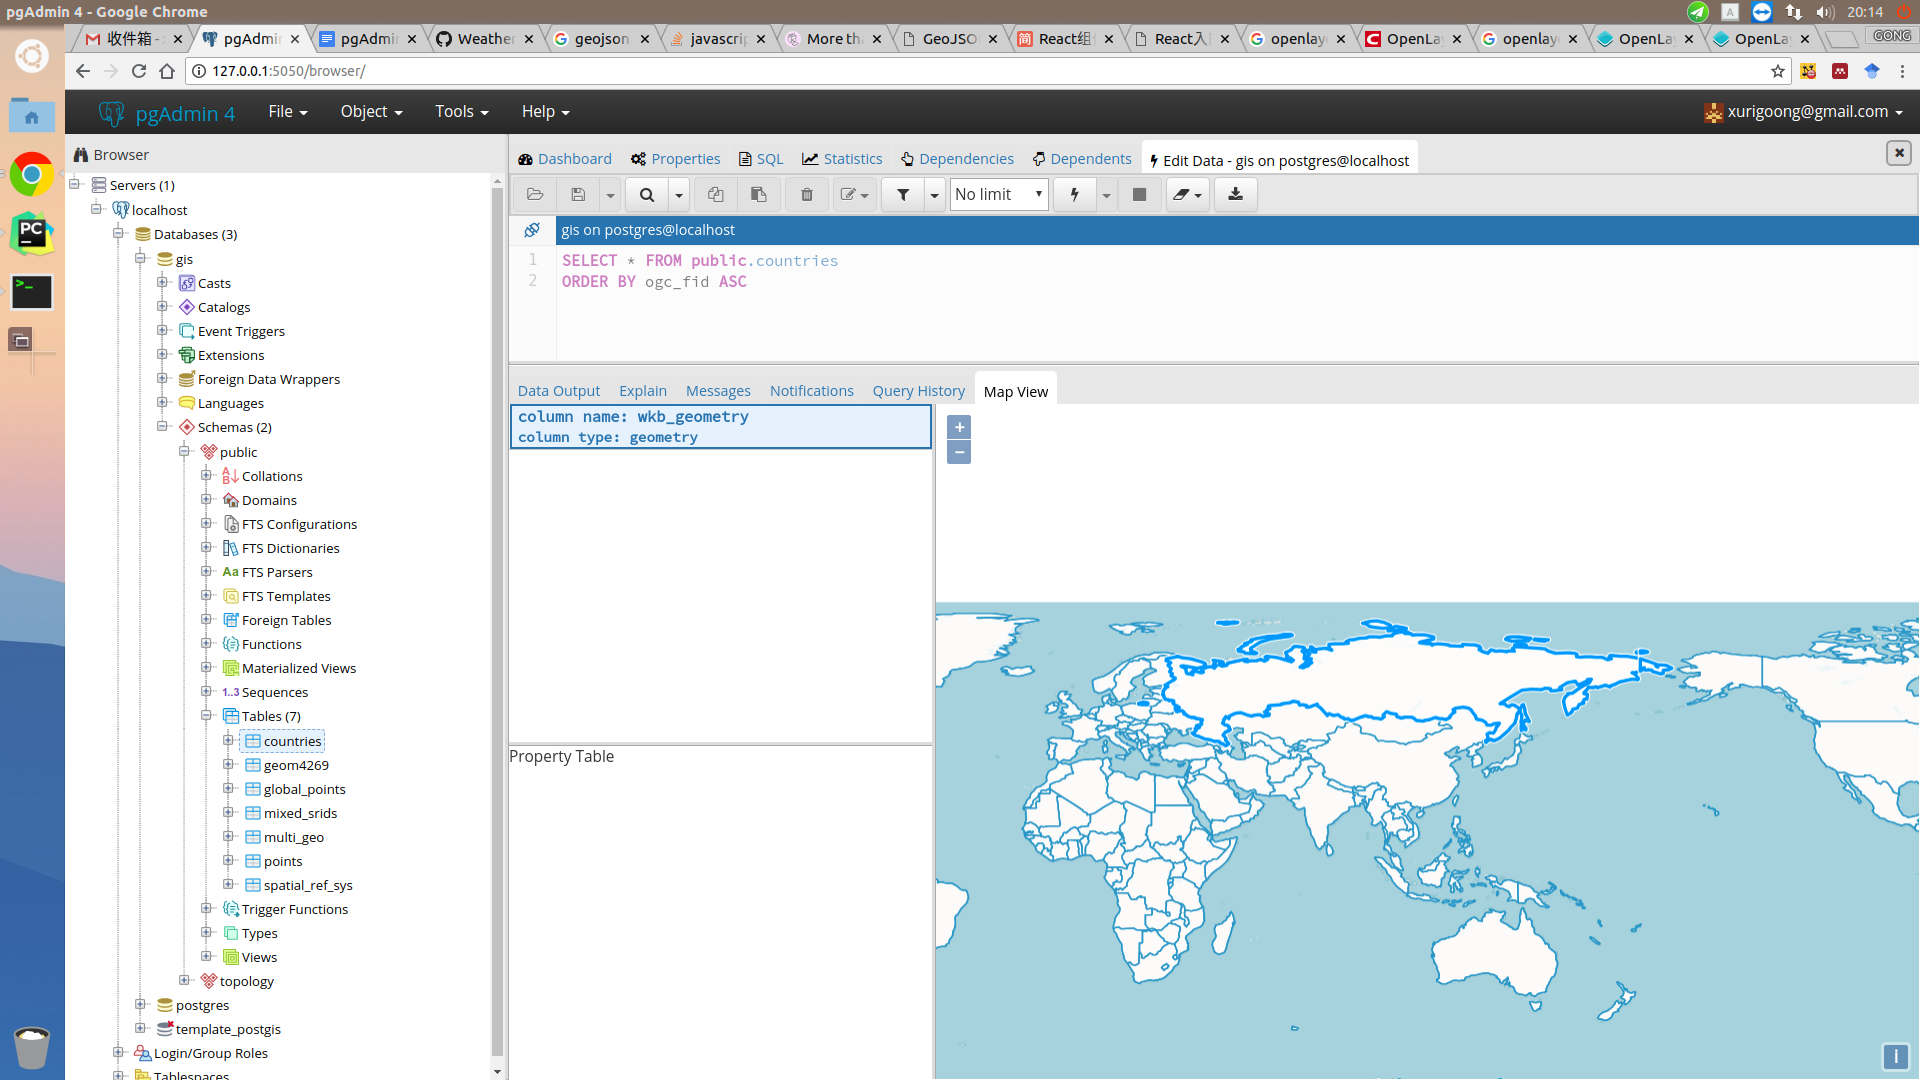
What do you plan on doing next week?
- Fix the bug caused by unknown SRID.
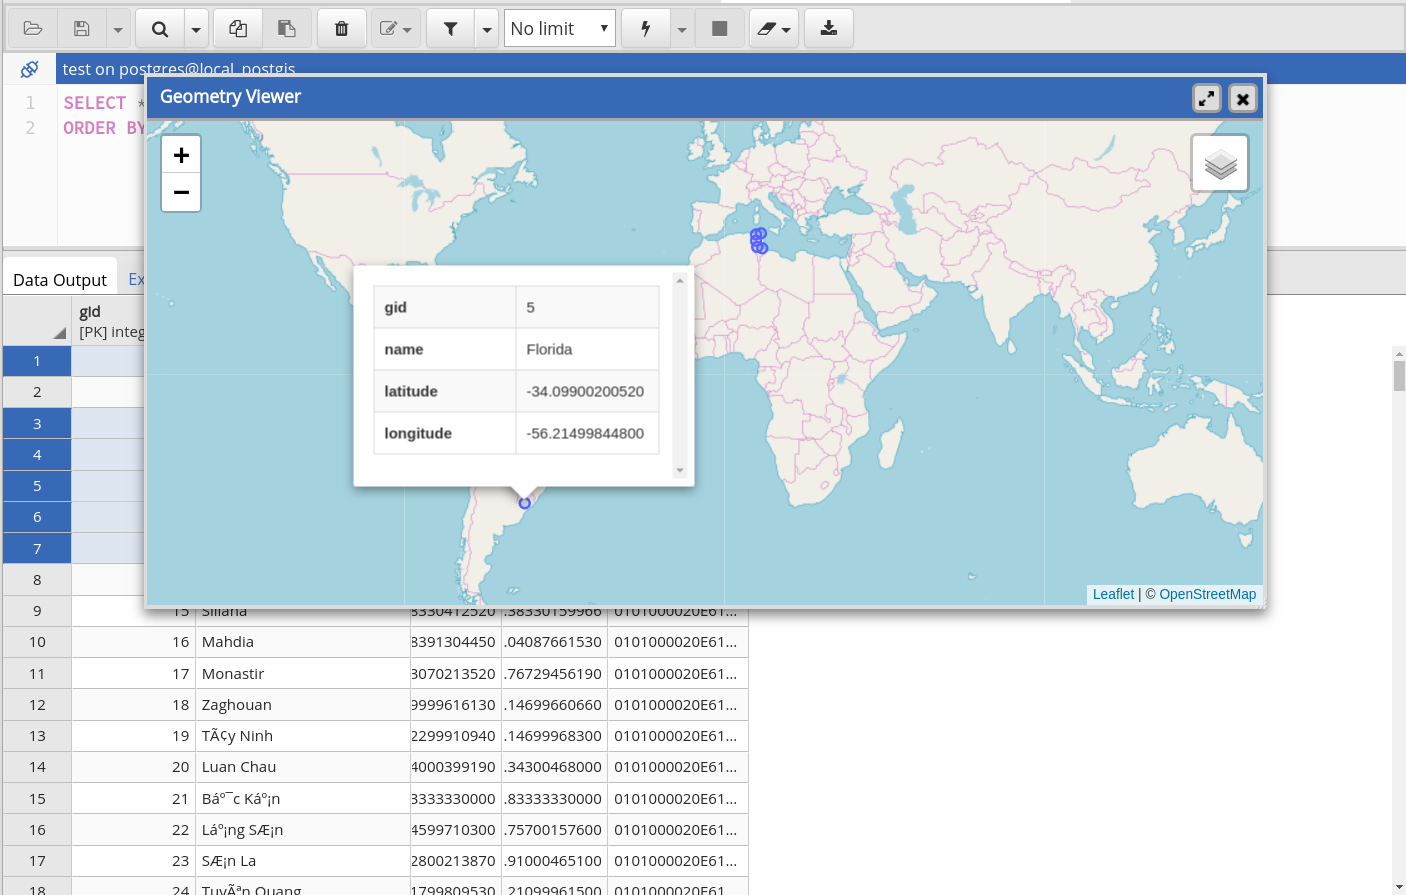
- Implement property table to show the property of selected geometry.
Week 9 (July 9 - 15) 
What did you get done this period?
- Fix the bug caused by undefined SRID: https://github.com/Gooong/pgadmin4/commit/cac6cfffb5c62c2dcbf5669aa01a82442fb9aae4
- Remove background layer when the SRID is not 4326 or 3857: https://github.com/Gooong/pgadmin4/commit/cac6cfffb5c62c2dcbf5669aa01a82442fb9aae4
- Implement property tabe to show the properties of selected geometry: https://github.com/Gooong/pgadmin4/commit/0e6119560ba96ba1d66bfe69b13b99967560d3ed
What do you plan on doing next week?
- Create and execute unit tests in the regression frame for all modules to help catch regressions in the code.
- Check the code style to meet the pgAdmin coding standards.
Week 10 (July 16 - 22) 
What did you get done this period?
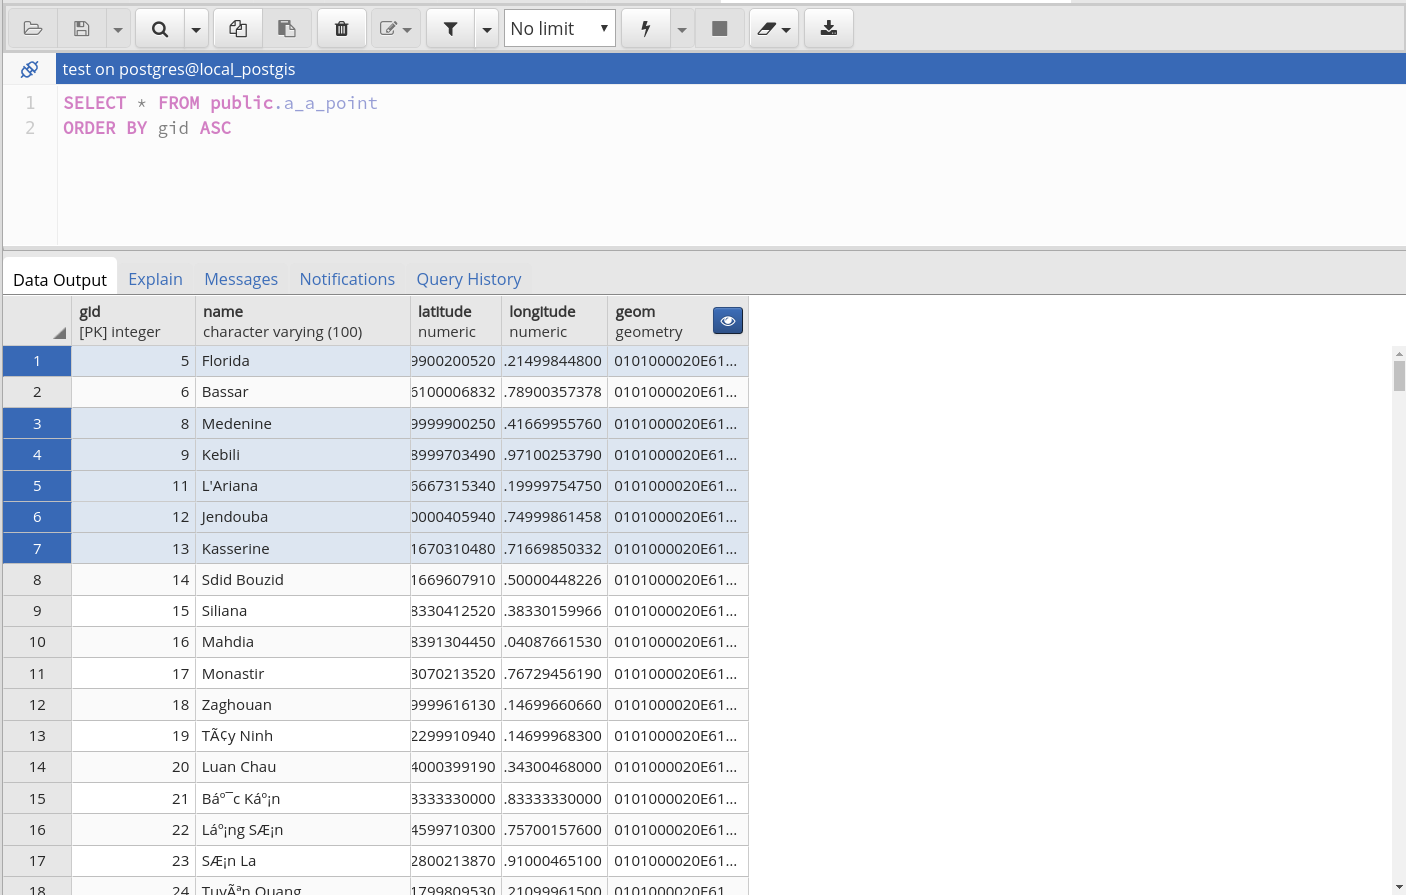
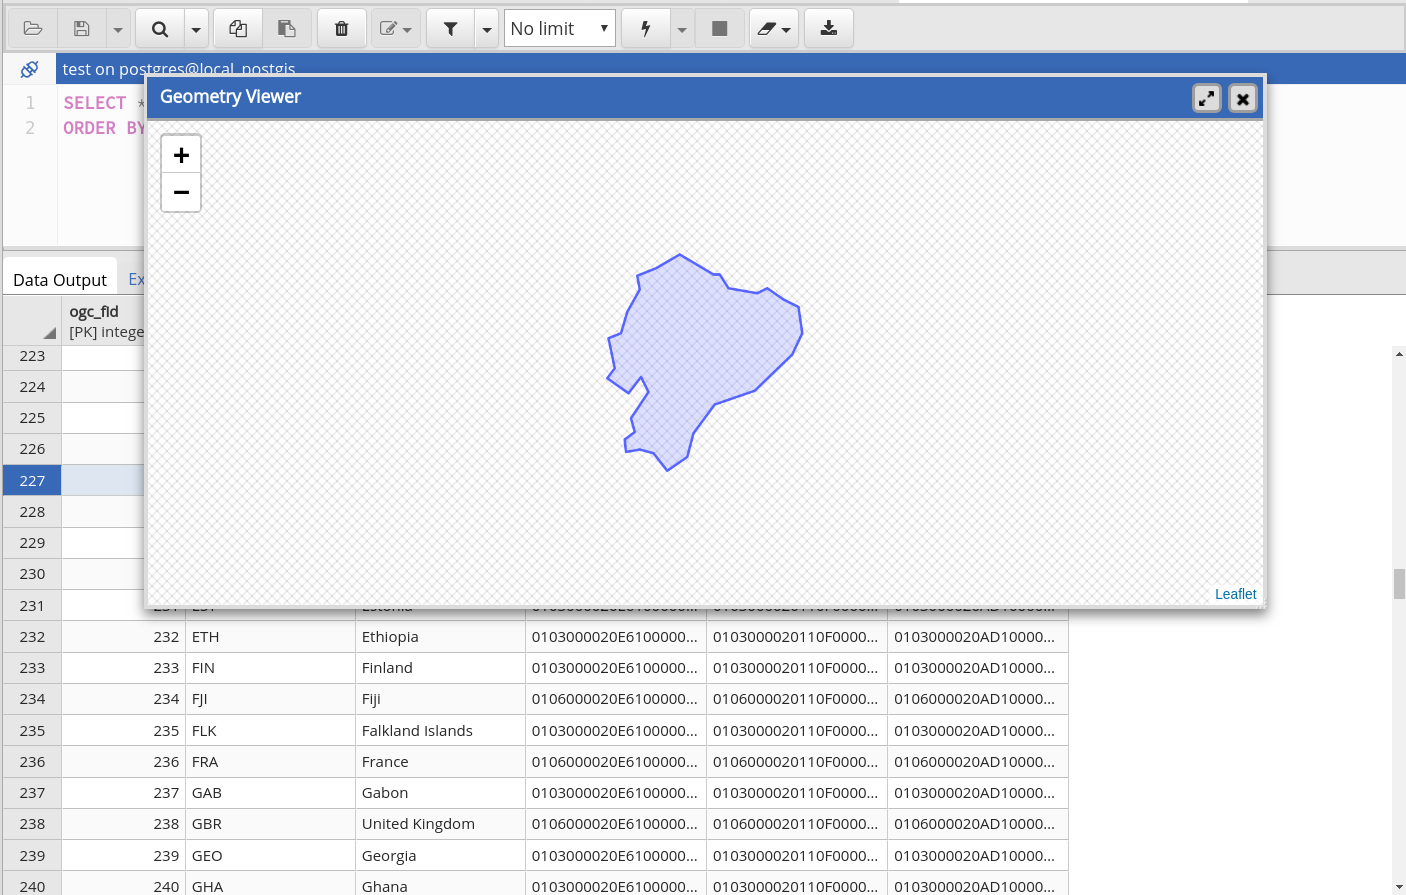
- Create visualiser for individual geometry in datagrid: https://github.com/Gooong/pgadmin4/commit/d6407baa3a0a96adac169d183bed8bc044dbb8f5
- Fix image url errors in leaflet: https://github.com/Gooong/pgadmin4/commit/3b160b668c4f9b5867b4b2189714c934a5de85c6
This visualiser is independent from the geoviewer and is in the geometry_visualiser branch. Here is the screen shot:
What do you plan on doing next week?
- Create test for both geometry_visualiser and geoviewer.
- Check the code style to meet the pgAdmin coding standards.
Week 11(July 23 - 29) 
What did you get done this period?
- Add tests for geometry_viewer: https://github.com/Gooong/pgadmin4/commit/500160c9e050d42d0e725ff84e7e1ed85213e050
- Add comlumn header button in datagird: https://github.com/Gooong/pgadmin4/commit/3aa7a3c197283c01d6bf3497c8ac85ea0596ab9f
- Clean code, add documents and check code style:
- Add property table: https://github.com/Gooong/pgadmin4/commit/0c26ab99293a2a6c69514c71f9267295dfbec5fa
What do you plan on doing next week?
- Send the patch in pgAdmin-hacker mailing list for code review.
- Prepare for final evaluation.
Week 12(July 30 - August 5) 
What did you get done this period?
- Add documents for the viewer: https://github.com/Gooong/pgadmin4/commit/8a9ef50f13554b421b56df14ef0b541cb7bc67e9
- Fix bugs and add adjustment:
- Send the patch in pgadmin-hackers mailing list: https://www.postgresql.org/message-id/CAA7HE_fnAKtAqfzz2jNZGfYnB5BAcuSt_ZCsJ%2Be-nwFPDHCdxg%40mail.gmail.com
What do you plan on doing next week?
- Create the final report page and finish the final evaluation.
Attachments (10)
-
Proposal for GSoC 2018.pdf
(635.3 KB
) - added by 7 years ago.
GSoC Proposal
- geoviewer screenshot 1.png (470.0 KB ) - added by 7 years ago.
- geoviewer screenshot 2.png (429.0 KB ) - added by 7 years ago.
-
Screenshot from 2018-07-08 20-14-24.png
(378.0 KB
) - added by 7 years ago.
screenshot 3
- geometry_visualiser_screenshot1.png (239.9 KB ) - added by 7 years ago.
- geometry_visualiser_screenshot2.png (506.0 KB ) - added by 7 years ago.
- Selection_013.png (134.5 KB ) - added by 7 years ago.
- Selection_014.png (221.1 KB ) - added by 7 years ago.
- Selection_015.png (439.0 KB ) - added by 7 years ago.
- Selection_016.png (116.8 KB ) - added by 7 years ago.