Opened 15 years ago
Closed 15 years ago
#574 closed defect (fixed)
OSGeo SVN server(s) unresponsive during certain hours of the day
| Reported by: | jng | Owned by: | |
|---|---|---|---|
| Priority: | normal | Milestone: | |
| Component: | SysAdmin | Keywords: | |
| Cc: |
Description 
I usually svn commit/update/checkout around the hours 5.30pm-9.00pm A(ustralian)EST
But it seems these past few weeks that the SVN/Trac server goes off to a long lunch around these hours. Most svn activity around this time usually times out. The trac instances around this time usually time out as well.
Any ideas what's going on? I am primarily working on the MapGuide Open Source project if it helps, but I think other OSGeo projects would be affected as well. Case in point, it took me some time to be actually able to submit this ticket
Change History (9)
follow-up: 2 comment:1 by , 15 years ago
comment:2 by , 15 years ago
Replying to crschmidt:
- We don't know why.
I don't like that situation, and so I wrote & have started running this script on xblade13 and 14 as a test. Will post a plot of the results after some time. If you think it is useful feel free to run it on the more strained servers.
log_cpu.sh:
#!/bin/sh

# script to log cpu use etc.

# log every 5 minutes
interval=300

outfile=~/"cpu_use.`hostname`.log"

#echo "Will consume about $((50 * 3600/300 * 24 / 1024)) kb/day"

echo "#year/day hr:min TZ cpu_1min_avg cpu_5min_avg cpu_15min_avg cpu_hog hog_cpu% free_mem_mb" >> "$outfile"

while [ 1 -eq 1 ] ; do
   unset TIMESTAMP CPU_USAGE CPU_HOG FREE_MEM
   TIMESTAMP=`date -u '+%Y/%j %k:%M UTC'`
   CPU_USAGE=`uptime | cut -f5 -d: | sed -e 's/,//g' -e 's/^ //'`
   CPU_HOG=`top -b -n 1 | sed -e '1,7d' | head -n 1 | awk '{print $12 " " $9}'`
   FREE_MEM=`free -m | grep 'buffers/cache' | awk '{print $4}'`
   sleep 1
   echo "$TIMESTAMP $CPU_USAGE $CPU_HOG $FREE_MEM" >> "$outfile"
   sleep `expr $interval - 1`
done
example output from this morning's xblade13
#year/day hr:min TZ cpu_1min_avg cpu_5min_avg cpu_15min_avg cpu_hog hog_cpu% free_mem_mb
2010/146 20:21 UTC 0.00 0.03 0.00 rhn-applet-gui 2.0 894
2010/146 20:26 UTC 0.01 0.02 0.00 rhn-applet-gui 2.0 896
2010/146 20:31 UTC 0.00 0.00 0.00 init 0.0 896
2010/146 20:36 UTC 0.25 0.10 0.04 top 2.0 896
2010/146 20:41 UTC 0.06 0.06 0.02 top 2.0 898
2010/146 20:46 UTC  Xvnc 1.9 898
2010/146 20:51 UTC  top 2.0 899
2010/146 20:56 UTC  top 3.9 898
2010/146 21:01 UTC  top 1.9 896
2010/146 21:06 UTC  init 0.0 896
2010/146 21:11 UTC  init 0.0 897
2010/146 21:16 UTC  httpd 1.9 897
2010/146 21:21 UTC  top 3.9 897
2010/146 21:26 UTC  top 1.9 900
2010/146 21:31 UTC  top 1.9 897
2010/146 21:36 UTC  top 3.9 898
2010/146 21:41 UTC  top 2.0 898
2010/146 21:46 UTC 0.01 0.03 0.00 top 1.9 898
2010/146 21:51 UTC 0.05 0.03 0.00 init 0.0 900
2010/146 21:56 UTC 0.20 0.11 0.02 init 0.0 901
2010/146 22:01 UTC 0.14 0.09 0.03 httpd 2.0 900
2010/146 22:06 UTC 0.00 0.04 0.01 top 2.0 901
2010/146 22:11 UTC 0.17 0.11 0.03 nscd 2.0 900
hmmmm, that's weird, some uptime parsing bug..? may have to replace cut -f5 with sed -e 's/.*average://'.
personally I just trained myself not to be on the computer from 7-10pm local time as a work around for this issue :)
regards, Hamish
follow-up: 4 comment:3 by , 15 years ago
crschmidt wrote:
- We don't know why.
Martin S wrote:
BTW, I disagree on 2.).
so....... what is it? do we have proof or just long term suspicion? LDAP on osgeo1 going haywire?
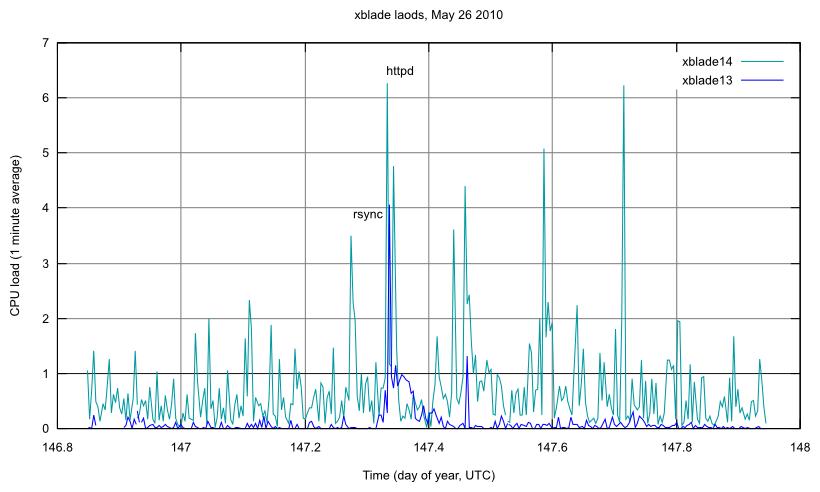
after 24 hours of load monitoring on xblade13 and 14 (see plot image attached to this ticket):
xblade13 (1.5GHz Athlon, 1GB RAM)
- pretty quiet execpt for 7:49 thru 9:54 UTC when rsync is running full bore (timing wrt the 8 o'clock "dead hour" is rather suspicious...)
xblade14 (1.5GHz Athlon, 1GB RAM)
- periodic large httpd bursts (flushing queue after a stall?),
- a number of mapserver jobs chewing up cpu,
- buildbots running (pid 3798 gdal build stuck & consuming a lot of RAM?)
- 24 hr avg load ~ 70% CPU utilization; min. 250mb RAM free
full logs available on request or just collect some yourself -- improved load monitoring script:
#!/bin/sh

# script to log cpu use etc.

# log every 5 minutes
interval=300

outfile=~/"cpu_use.`hostname -s`.log"

#echo "Will consume about $((50 * 3600/$interval * 24 / 1024)) kb/day"

echo "#year/day hr:min TZ cpu_1min_avg cpu_5min_avg cpu_15min_avg cpu_hog hog_cpu% free_mem_mb" >> "$outfile"

while [ 1 -eq 1 ] ; do
   unset TIMESTAMP CPU_USAGE CPU_HOG FREE_MEM
   TIMESTAMP=`date -u '+%Y/%j %k:%M UTC'`
   CPU_USAGE=`uptime | sed -e 's/^.*average://' -e 's/,//g' -e 's/^ //'`
   CPU_HOG=`top -b -n 1 | sed -e '1,7d' | head -n 1 | awk '{print $12 " " $9}'`
   FREE_MEM=`free -m | grep 'buffers/cache' | awk '{print $4}'`
   sleep 1
   echo "$TIMESTAMP $CPU_USAGE $CPU_HOG $FREE_MEM" >> "$outfile"
   sleep `expr $interval - 1`
done
(plot)
file=cpu_use.xblade13
cat $file.log | sed -e 's/^#.*//' | cut -f2 -d/ | \
  tr ':' ' ' | tr -s ' ' | cut -f1-3,5 -d' ' | awk \
  '{ if(/./) {printf("%f %s\n", $1 + $2/24 + $3/(24*60), $4)} else {print} }' \
  > $file.prn
# ...

( cat << EOF
set terminal svg size 800 480
set output "cpuload.svg"
set grid
set xlabel 'Time (day of year, UTC)'
set ylabel 'CPU load (1 minute average)'
set title 'xblade laods, May 26 2010'
set label "httpd" at 147.332, 6.5
set label "rsync" at 147.278, 3.9
set arrow from 146.8,1 to 148,1 nohead lt -1 lw 0.75

plot "cpu_use.xblade14.prn" title 'xblade14' with lines lt 8, \
     "cpu_use.xblade13.prn" title 'xblade13' with lines lt 3
EOF
) | gnuplot

inkscape --file=cpuload.svg --export-png=cpuload.png -b white
regards, Hamish
comment:4 by , 15 years ago
Replying to hamish:
xblade13 (1.5GHz Athlon, 1GB RAM)
- pretty quiet execpt for 7:49 thru 9:54 UTC when rsync is running full bore (timing wrt the 8 o'clock "dead hour" is rather suspicious...)
also on xblade13 between 8am and 8.30-9am UTC every day the awstats.pl (web site usage logs->html stats) process is sucking up 90%+ cpu. perhaps that could be moved away from the rsync cron job by a few hours so everying isn't happening all at once, and reniced to some low priority if not already?
thanks, Hamish
follow-up: 6 comment:5 by , 15 years ago
I have taken liberty to "nice" the awstats on xblade14:
# before
[root@xblade14 neteler]# crontab -l
50 3 * * * /usr/local/awstats/tools/awstats_updateall.pl now

# after (now)
[root@xblade14 neteler]# crontab -l
50 3 * * * nice /usr/local/awstats/tools/awstats_updateall.pl now
On xblade13 (download) I have added "nice", too:
[root@xblade13 neteler]# cat /osgeo/scripts/update_logs.sh
#!/bin/bash
nice /usr/local/awstats/wwwroot/cgi-bin/awstats.pl -config=www.download.osgeo.org
nice /usr/local/awstats/wwwroot/cgi-bin/awstats.pl -config=mapguide.download.osgeo.org
Let's see if that helps.
Markus
comment:6 by , 15 years ago
Replying to neteler:
I have taken liberty to "nice" the awstats on xblade14:
...
On xblade13 (download) I have added "nice", too:
...
Let's see if that helps.
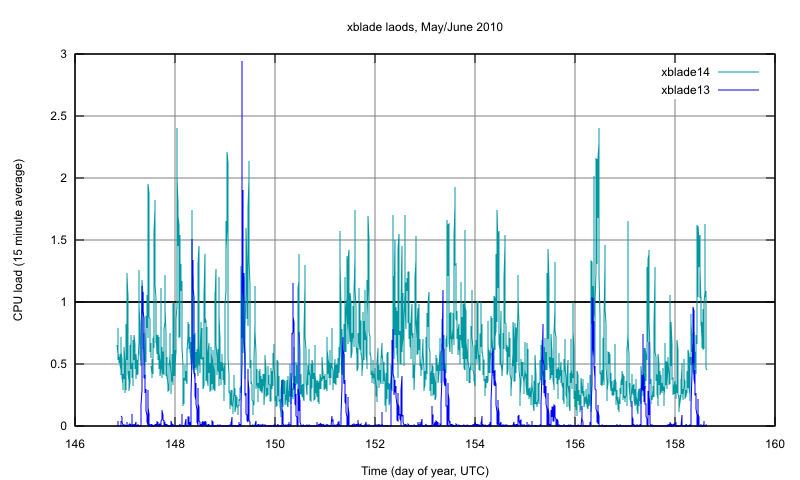
see updated plot (attached).
- xblade13 avg load (avg of 15min avgs): 7%
- xblade14 avg load (avg of 15min avgs): 56%
xblade13 had big spikes before you made the change on day 150, none after. Who knows, but we'll call that a win. xblade14 still has too much stuff running on it so it's hard to notice any change.
after being unable to log in the other day, I tried back at about 10.30 and finally got in, the rsync [ie heavy disk i/o] had already finished an hour+ earlier. So I guess we go back to blaming ldap?
Hamish
by , 15 years ago
| Attachment: | cpuload_june8.png added |
|---|
comment:7 by , 15 years ago
| Resolution: | → fixed |
|---|---|
| Status: | new → closed |
Trac/SVN were routinely loaded because they were on a machine that couldn't cope with the load they were dealing with, to be frank. These machines were bought and set up when the OSGeo load was 1/10th of what it is now.
In any case, "OSGeo SVN Server unresponsive during certain hours of the day" is not something that has any relevance to the previous situation anymore, because trac/svn are now on a new server. If we see this happening agin, we should open a new ticket.
The short answer is: