Opened 15 years ago
Closed 15 years ago
#489 closed enhancement (fixed)
Display server load info in Trac
| Reported by: | Mateusz Łoskot | Owned by: | |
|---|---|---|---|
| Priority: | normal | Milestone: | |
| Component: | SysAdmin | Keywords: | trac |
| Cc: |
Description
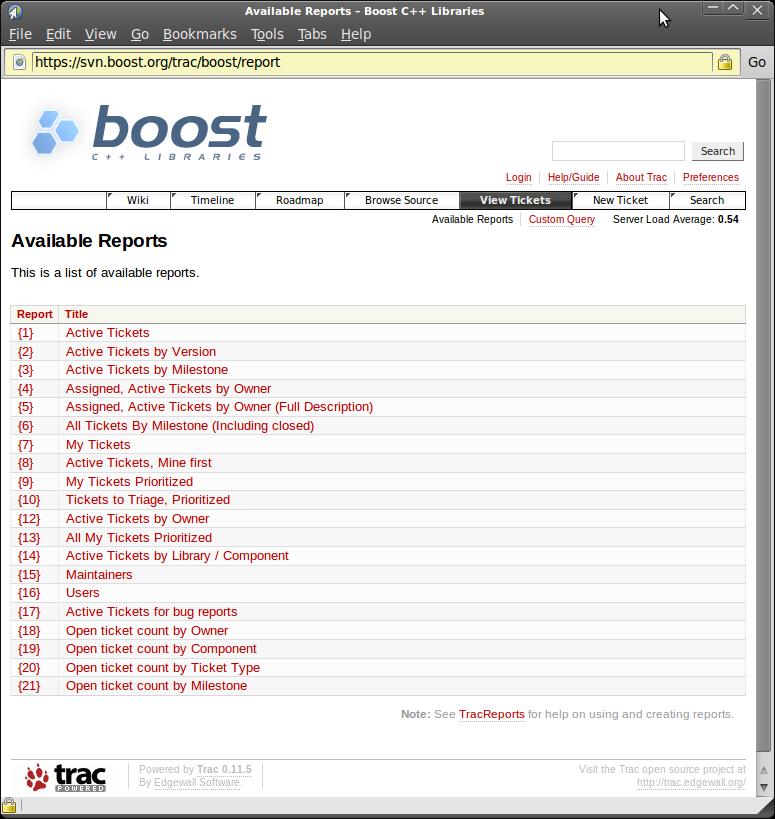
Trac installation for Boost displays close to upper right corner Server Load Average information (see attached screenshot). Having in mind that we were experiencing some server load issues, perhaps it would be good to display this information in OSGeo Trac instances too.
I'm not sure if this feature is provided by Trac and only some config setting needs to be switched on or perhaps it's a plugin. If there is an interest but it's a problem with finding where this information comes from, let me know and I'll ask Boost folks.
Attachments (1)
Change History (5)
by , 15 years ago
| Attachment: | boost-trac-server-load-info.jpg added |
|---|
comment:1 by , 15 years ago
Even if not used, it would be useful to ping to Boost webadmins and ask how they do it.. and why.
cat /proc/loadavg
Hamish
comment:2 by , 15 years ago
I've got in touch with administrators of Boost Trac and they were very kind to provide me with details. Here we go:
- They confirmed server load issues:
Yes, we were experiencing the load issues in the Boost Trac even though we are hosting one Trac instance in our server for now. I think the load issues are from the web spider crawling the huge boost SVN repository tree. We disallowed the crawling and we will start to open up little by little watching the load average.
- How to set up the server load display
This is based on their customized template(theme.html) in the Trac. They put the following code in boost_trac_path/templates/theme.html of trac instance after copying it from the Trac installation tree to boost_trac_path/templates:
   <div id="main">
      <div id="ctxtnav" class="nav">
        <h2>Context Navigation</h2>
          <ul>
              <li py:for="i, elm in enumerate(chrome.ctxtnav)"
                  class="${classes(first_last(i, chrome.ctxtnav))}">$elm</li>
    <!-- Added for displaying load average -->
       <?python
       f = open(r'/path/to/file/loadaverage.txt')
       loadavg = f.read()
       f.close()
       ?>
       <py:if test="loadavg" >
              <li class="last">Server Load Average:
          <b>${loadavg}</b>
              </li>
       </py:if>
    <!-- Added for displaying load average -->
          </ul>
        <hr />
      </div>
Next, they configure set up a cronjob to generate the loadaverage on /path/to/file/loadaverage.txt at every 10 mins.
[19:03]: templates % cat /path/to/file/loadaverage.txt
1.03
[19:03]: templates %
That's it and thanks to Boost admins!
comment:3 by , 15 years ago
I've just got a message from Dave Abrahams and Dave confirms they've experienced problems too:
FWIW, BoostPro also has that problem. We're investigating ways to reduce Trac's memory usage, and also looking into alternatives such as redmine.
comment:4 by , 15 years ago
| Resolution: | → fixed |
|---|---|
| Status: | new → closed |
I think the answer here is "make trac not be so loaded." this is why we moved servers. If we feel that there is still really a need for this, feel free to reopen this ticket.
Server Load Average displayed in Trac of Boost project.