
| Version 16 (modified by , 16 years ago) ( diff ) |
|---|
How-To Test GRASS6 
Scope of this page 
This pages is intended to users and developers who want to test a GRASS installation (test protocol). As side effect, you can also showcase GRASS 6 using these commands.
Table of Contents
Requirements 
- GRASS 6 installation (source code and binaries download)
- Educational data set: OSGeo Educational data set North Carolina: data and description.
Extract the NC sample data set for GRASS:
mkdir $HOME/grassdata
tar xvfz nc_spm_latest.tar.gz
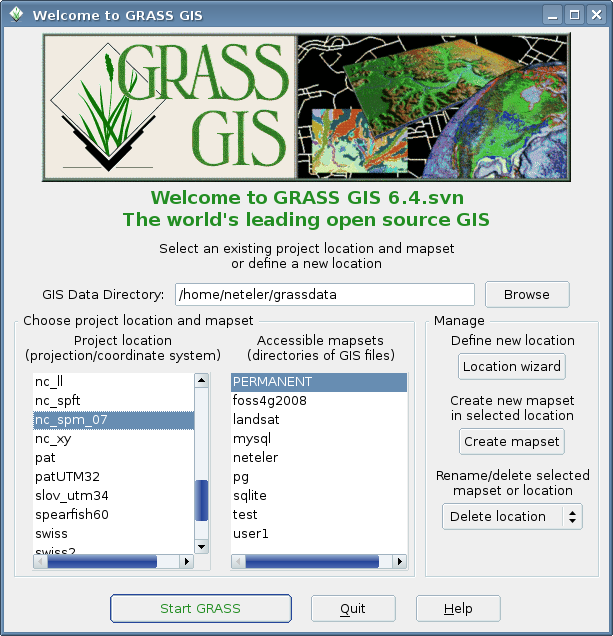
Start of the program 
GRASS 6 is started either from the menu (if installed therein) or from command line. In all cases, select mapset "user1".
# show available options
grass64 --help
Expected result: the help text should be shown.
# start with current Tcl/Tk based graphical user interface (g.gis)
grass64 -tcltk

# start with wxPython based graphical user interface
grass64 -wxpython
Expected result: the selected graphical user interface should come up.

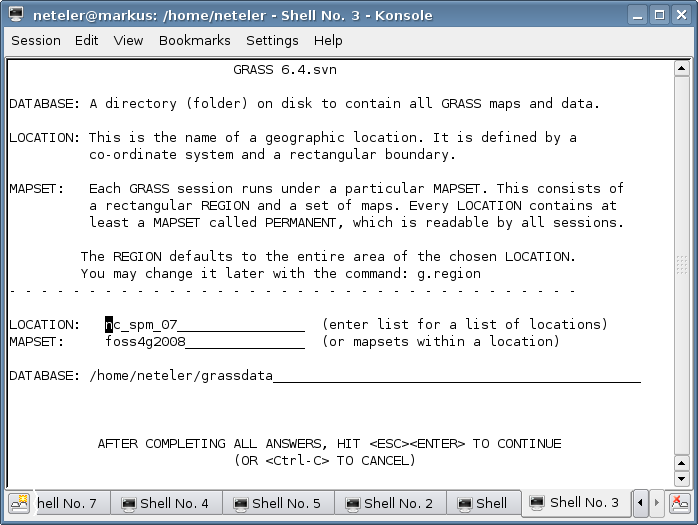
# start with text based interface
grass63 -text
Expected result: the text user interface should come up.

Re-launch of GUI from command line 
# start with current Tcl/Tk based graphical user interface (g.gis)
g.gui tcltk

# start with wxPython based graphical user interface
g.gui wxpython
Expected result: the selected graphical user interface should come up.
Using gis.m graphical user interface 
- To add a raster map, click in GIS manager on "Add raster layer" button,
- Click on word "raster1" which appears in the canvas to enable in the lower part the raster map tool (should already be there)
- In "Display raster maps", select "Base map" button, explode "PERMANENT" mapset, and select map "elevation" (click ok or use double click on map name)
- The map name should have appeared in canvas
- Get second "Map Display 1" window on top, therein click on "Display active layer" button (most left): it should display the elevation map.
- Try to zoom (open with left mouse button a zoom box)
- Create a profile ("Create profile" button)
- In "Profile window" tool, use left button to select raster map gaina ("elevation" in PERMANENT)
- Click "Draw profile transect" to draw a transect in the main map window
- Click "Draw profile" button to draw it. Each transect turn is indicated as vertical line in the profile.
- To add a vector map, click on the "Add vector layer" button
- Click on word "vector1" which appears in the canvas to enable in the lower part the vector map tool (should already be there)
- In "Display vector maps", select "Vector map" button, explode "PERMANENT" mapset, and select map "roadsmajor" (click ok or use double click on map name)
- The map name should have appeared in canvas
- Get second "Map Display 1" window on top, therein click on "Display active layer" button (most left): it should display the elevation map.
Expected result: it should just work.
Using wxPython graphical user interface 
- Click in Layer manager on "Add raster map" button,
- select raster map "elevation" in properties dialog and click "ok",
- right mouse click in layer tree and choose from contextual menu "Zoom to selected map", map should appear in canvas.
- Try to zoom, to create a profile etc.
Expected result: it should just work.
Display various maps in GRASS monitor 
(NOTE: not for native winGRASS, but for Cygwin-winGRASS and Unix compliant installations)
As first step on the command line we set the current region to extent and resolution of the elevation raster map. Then we open a graphical map display ("GRASS monitor") and display the map:
g.region rast=elevation -p
d.mon x0
d.rast elevation
d.vect roadsmajor
Expected result: GRASS monitor should open and show the selected maps
Display as shaded terrain map:
d.his i=elevation_shade h=elevation
d.vect roadsmajor

# set barscale position per mouse click into map:
d.barscale -mt
3D visualiztion with NVIZ 
# raster map and 2D vector lines map
 nviz elevation vect=roadsmajor
# raster map and 2D vector lines map and 3D vector points
nviz elevation vect=roadsmajor points=precip_30ynormals_3d
Tests: navigate with the puck, interrogate map, etc. (ADD MORE)
Expected result: should not crash at all but show maps as expected
Simple raster analysis 
Raster analysis comprises a lot of functionality.
Raster algebra 
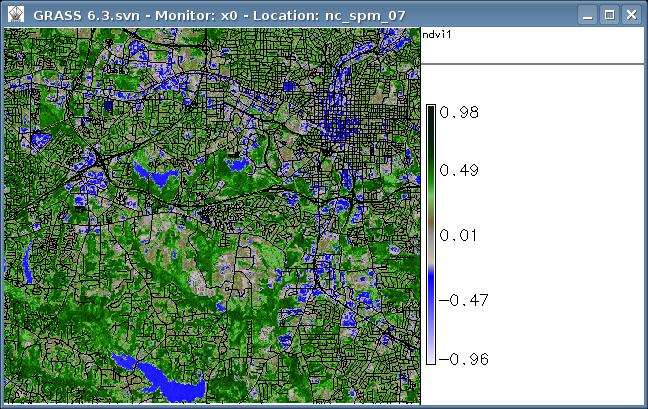
Normalized Differences Vegetation Index (NDVI) from LANDSAT-TM7:
# set current region/resolution to map:
g.region rast=lsat7_2002_40 -p
# display metadata:
r.info -h lsat7_2002_40
# generate NDVI:
r.mapcalc "ndvi = 1.0 *  (lsat7_2002_40 - lsat7_2002_30) / (lsat7_2002_40+ lsat7_2002_30)"
r.info -r ndvi
r.colors ndvi color=ndvi

# display 2D:
d.mon x0
d.rast.leg ndvi
d.vect streets_wake
# display 3D:
nviz elevation col=ndvi vect=streets_wake
Expected results: the NDVI map should be colorized in near natural colors, see screenshot:

Raster statistics 
Univariate statistics:
r.univar ndvi
Expected results: minimum: -0.956522, maximum: 0.978723, mean: 0.190006 etc.
Simple vector analysis 
- TBD
Extracting from vector maps 
- extract large streets from "streets_wake"
SQL support 
g.region vect=schools_wake -p
d.erase

# show all schools in Wake County
d.vect schools_wake col=red icon=basic/circle siz=5

# show a subset of all elementary schools in Raleigh
d.vect schools_wake where="ADDRCITY='Raleigh' and GLEVEL='E'"
Vector statistics 
Univariate statistics:
# show available columns
v.info -c precip_30ynormals_3d
v.univar precip_30ynormals_3d col=annual type=point
Expected result: mean: 1289.31 etc.
Transfer raster slope to vector segments 
- v.split, v.to.db
Shortest path routing 
- NC bus routes... map "busroutesall"
Using QGIS' GRASS toolbox 
Start "qgis" within GRASS shell.
- Go menu "Plugins, Pluginmanager, activate "GRASS plugin", OK button: a set of new buttons should appear
- click "Add GRASS raster layer" button, select "elevation" map
- click "Add GRASS raster layer" button, select "elevation_shade" map
- click right mouse button in legend on "elevation_shade" map, move transparency to 40%
- click "Add GRASS vector layer" button, select "roadsmajor" map, select layer "1-line" (level 1 is the topological level), OK
See Also 
The following demos are related to the GRASS book, 3rd edition 2008 (based on NC data set):
Attachments (5)
-
nc_ndvi.jpg
(99.4 KB
) - added by 17 years ago.
North Carolina Raleight NDVI from Landsat
-
grass64_wx_start.png
(165.5 KB
) - added by 16 years ago.
screenshot
-
grass64_text_start.png
(56.1 KB
) - added by 16 years ago.
text startup
-
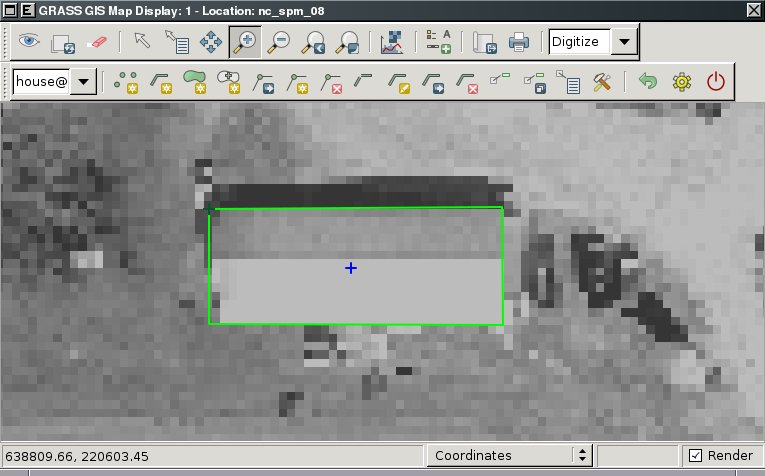
grass64_digitize.jpg
(58.6 KB
) - added by 15 years ago.
wxGUI digitizer (house)
-
grass64_nviz_3dhouse.jpg
(70.8 KB
) - added by 15 years ago.
wxGUI 3D view mode
Download all attachments as: .zip