
| Version 11 (modified by , 3 years ago) ( diff ) |
|---|
Table of Contents
GRASS GIS Mini Project 2022: Space-Time Dataset Visualization and Improved Interactive Maps for grass.jupyter 
| Title: | Space-Time Dataset Visualization and Improved Interactive Maps for grass.jupyter |
| Student Name: | Caitlin Haedrich, North Carolina State University |
| Mentor Name: | Vaclav Petras, Helena Mitasova, Stephan Blumentrath |
| GitHub Fork: | View Repo |
| Proposal: | View Proposal |
| Budget: | 1000 € (via GRASS GIS Student Grants) |
Abstract 
During GSoC 2021, we created “grass.jupyter”, a package that improves the integration of GRASS GIS and Jupyter with a set of functions for displaying GRASS data in Jupyter Notebooks. In its current state, “grass.jupyter” allows users to create static visuals and simple interactive maps. However, several additional features are needed to allow Jupyter users to fully and easily access the power GRASS, including space-time dataset visualization and more options for interactive mapping (such as color or vector attribute access).
Goal 
This project had three main objectives:
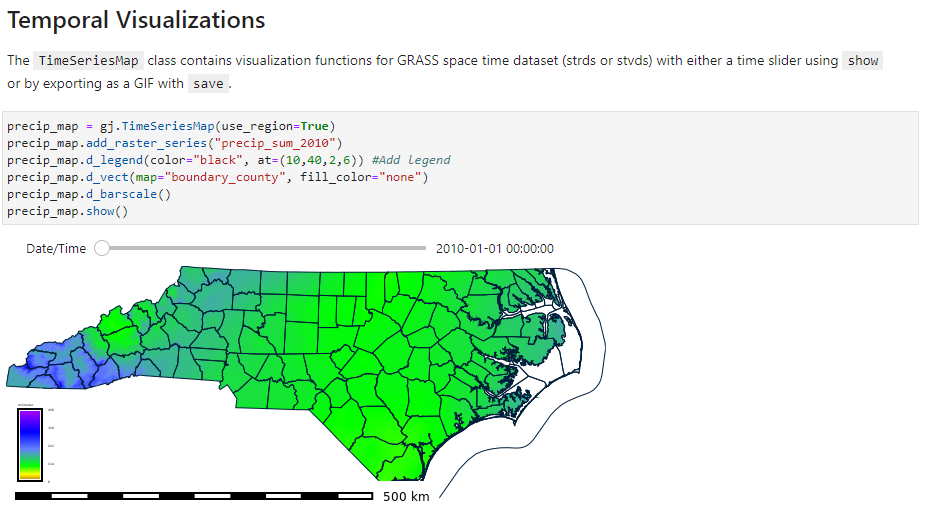
- create a class for visualizing space time datasets allowing users to create interactive time-sliders and non-interactive animations such as GIFs.
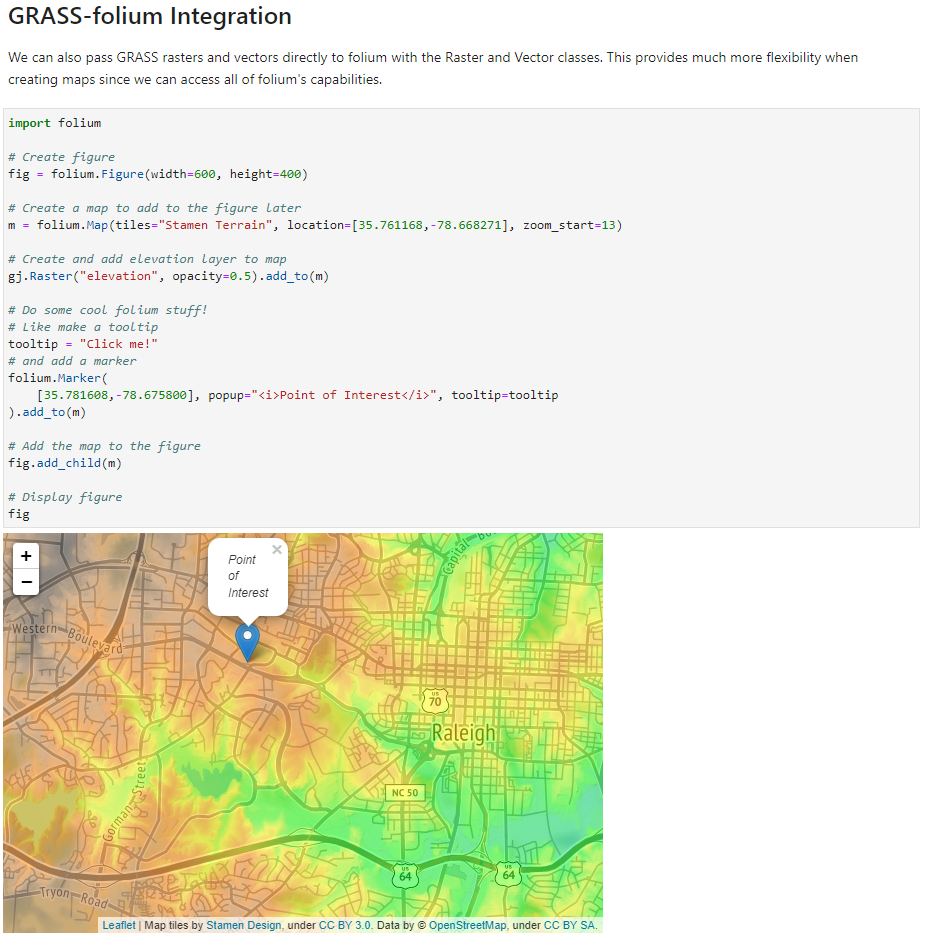
- improve the integration of grass and folium, the library used for InteractiveMap, so that users can access all of folium’s functionality. Currently, InteractiveMap allows users to add rasters and vectors to folium maps. Users can toggle between layers and export the map in HTML. However, folium allows for much more sophisticated mapping as well: users can control color, vector symbology, create heatmaps (point density maps) and view vector attributes with a click or hover. I propose to create new grass-folium objects that allow users to directly call folium (thus avoiding the problem of needing to wrap the entire folium library and continue to update as folium features change, depreciate and expand).
- create a function to display vector attribute data in nicely-formatted Pandas or GeoPandas tables (as opposed to text output which is currently possible with “v.db.select”).
Timeline 
Time Period | Milestones | |
|---|---|---|
Tasks | Status | |
January 10th - January 14th |
Project Intro Email |
Ok |
January 17th - January 21st | Draft of TimeSlider method | Ok |
January 24th - January 28th | Draft of time_slider and animate | Ok |
January 31st - February 4th | ||
February 7th - February 11th | ||
February 14th - February 18th | ||
February 21st - February 25th | ||
February 28th - March 4th | ||
Weekly reports 
Week 2 
Here's a quick update of what I worked on last week for my Mini Project on improving grass.jupyter.
1) What did I accomplish this week?
I started on visualization functions for space time datasets (strds and stvds). I created a grass.jupyter class called TimeSeries that will eventually have two methods: TimeSlider for creating an interactive time slider where users can scroll through the rendered maps and animate for creating animations of the space time datasets. I have a draft version of the TimeSlider working - currently, users have to switch through the maps with a drop down menu instead of a slider (or scroll with arrow keys) . You can test it out on Binder here and view the PR on GitHub.
2) What do I plan to do next week?
- Switch from a dropdown menu to a SelectionSlider for the
TimeSlidervisualization - Create more robust ways to add background and overlay layers to the
TimeSlider - Start the
TimeSeries.animate()function for animating space time datasets
3) Am I blocked on anything? No, I'm not currently blocked on anything.
Feedback, thoughts and comments welcome!
Week 3 
Here's a quick update on my Mini Project for improving grass.jupyter.
1) What did I accomplish this week?
- Switched from a Dropdown menu to a SelectionSlider for the
time_slidervisualization. I found a bug in ipywidgets which slowed me down a bit this week. I ended up opening an issue on GitHub and it was quickly addressed (go ipywidgets!). - Wrote
TimeSeries.animate()function for animating space time datasets You can test it out on Binder and view the PR.
2) What do I plan to do next week?
- Cleanup and write nice docstrings for TimeSeries visualizations
- The current visualizations are not great for multitemporal datasets (i.e. datasets with varying time steps), since the steps in the animation and time slider are all regularly spaced. Next week, I'll work on a way to address this.
- Maybe start working on GRASS-folium integration for interactive mapping
3) Am I blocked on anything? No, I'm not currently blocked on anything.
Feedback, thoughts and comments welcome!
Week 4 
Week 5 
Week 6 
Week 7 
Week 8 
Final Report 
Title: Title
Abstract:
The state of integration BEFORE the start of Mini Grant:
The state of integration AFTER Mini Grant:
Conclusion:
Future Work:
Attachments (2)
- timeseriesmap.PNG (137.8 KB ) - added by 3 years ago.
- grass-folium.PNG (592.3 KB ) - added by 3 years ago.
Download all attachments as: .zip