
Opened 16 years ago
Closed 16 years ago
#336 closed enhancement (fixed)
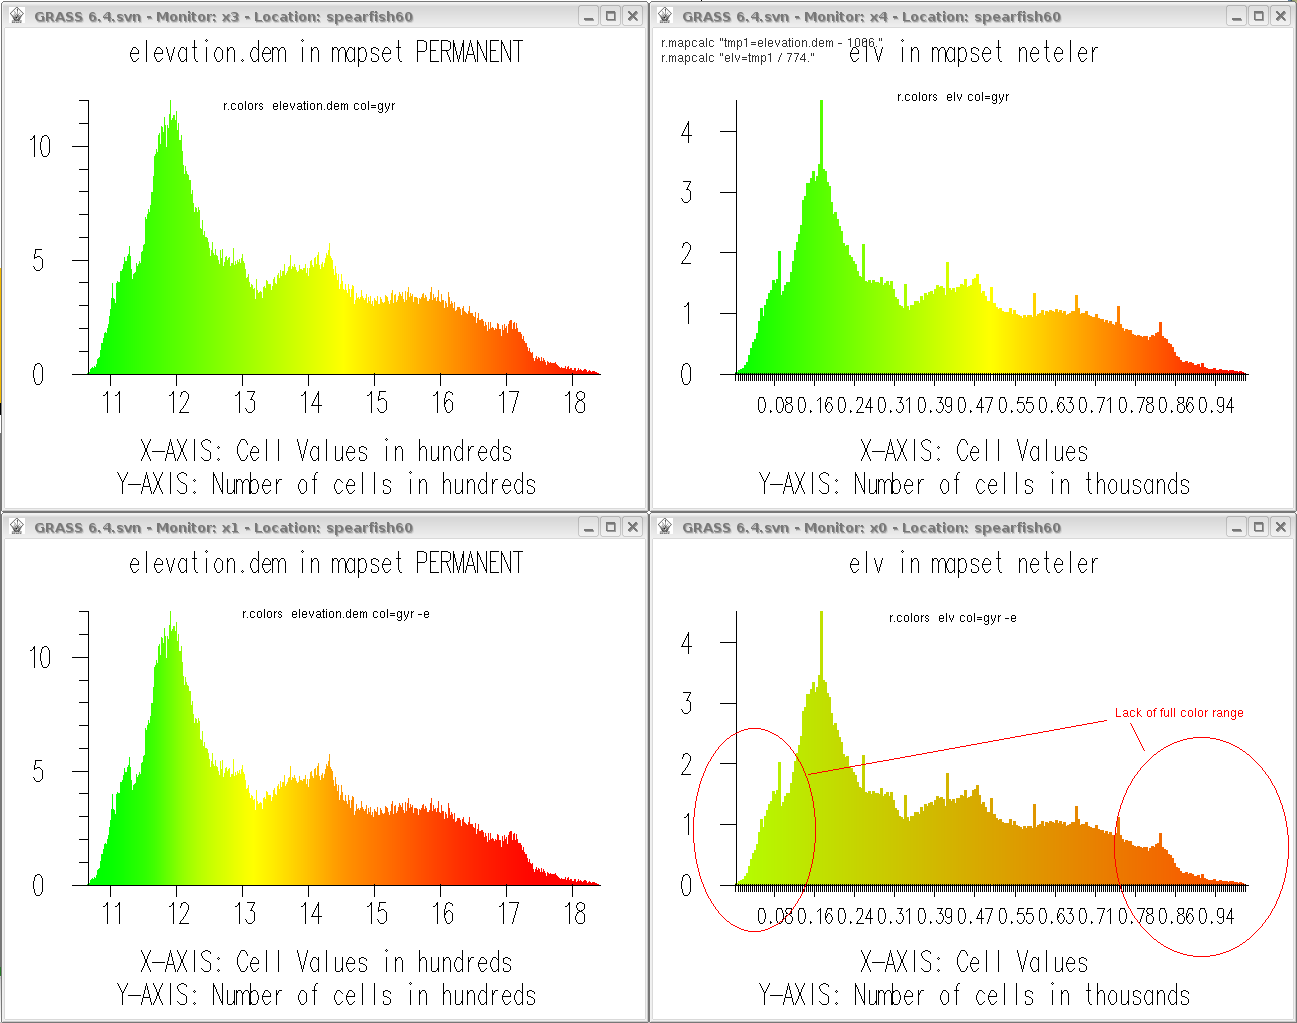
r.colors -e flag does not use full color range if map values are between 0. and 1.
| Reported by: | neteler | Owned by: | |
|---|---|---|---|
| Priority: | major | Milestone: | 6.4.0 |
| Component: | Raster | Version: | svn-trunk |
| Keywords: | Cc: | ||
| CPU: | All | Platform: | All |
Description 
Using r.colors -e on normalized maps show a color problem leading to low contrast maps. See attachment for illustration (histogram maps).
Markus
Change History (7)
comment:1 by , 16 years ago
comment:2 by , 16 years ago
Code to reproduce right side screenshots:
# Spearfish
g.region rast=elevation.dem
r.mapcalc "tmp1=elevation.dem - 1066."
r.mapcalc "elv=tmp1 / 774."
r.colors elv col=gyr
d.mon x4
d.histogram elv

r.colors elv col=gyr -e
d.mon x0
d.histogram elv
follow-up: 5 comment:3 by , 16 years ago
Replying to neteler:
Using r.colors -e on normalized maps show a color problem leading to low contrast maps. See attachment for illustration (histogram maps).
Histogram equalisation depends upon categories, which in turn depends upon quantisation. If you have a 0-1 map with "round" quantisation, you only get two categories, 0 (covering 0-0.5) and 1 (covering 0.5-1). If the map uses "truncate" quantisation, you get one category, 0 (covering 0-1).
The equalisation code takes the colour corresponding to the category's median value and maps it to the category's nominal value. See G_histogram_eq_colors() in lib/gis/color_xform.c for the actual code.
I suppose that I could change it to map the colour for the lower bound to cat and the colour for the upper bound to cat+1. However, I'm not sure there is really much point, given that histogram equalisation on one or two categories doesn't seem to be of much practical use.
Ultimately, decent histogram equalisation for FP data will require replacing the use of the Cell_stats code with something else (i.e. binning the data into arbitrary FP ranges, rather than one bin per integer category). Also, it will need to use logarithmic (geometrically-spaced) bins in order to work well with -g (log scaling).
comment:4 by , 16 years ago
| Type: | defect → enhancement |
|---|
Thanks for the insights.
At this point I should simply normalize to 100 instead of 1 (I am normalizing indeed the output of r.texture). And hope for a better histogram equalisation for FP data in a future GRASS version.
Markus
comment:5 by , 16 years ago
Replying to glynn:
Ultimately, decent histogram equalisation for FP data will require replacing the use of the Cell_stats code with something else (i.e. binning the data into arbitrary FP ranges, rather than one bin per integer category). Also, it will need to use logarithmic (geometrically-spaced) bins in order to work well with -g (log scaling).
Implemented in r33889 (7.0).
Currently hardcoded to 1000 bins, which should provide reasonable quality without creating excessively large colour tables.
comment:6 by , 16 years ago
| Resolution: | → fixed |
|---|---|
| Status: | new → closed |
Very nice, thanks. Tested and backported as r33903 to 6.4.svn.
Markus
Replying to neteler:
(attachment is missing)
Hamish