Opened 10 years ago
Closed 10 years ago
#3010 closed enhancement (duplicate)
PostGis Topology performance improvements: edge_data indexes
| Reported by: | Björn Harrtell | Owned by: | strk |
|---|---|---|---|
| Priority: | medium | Milestone: | |
| Component: | topology | Version: | 2.1.x |
| Keywords: | Cc: |
Description
Hi,
I've been following the effort to investigate and improve topology performance.
I've used pg_stat_statements (with track all) to get statement statistics when loading a dataset of 100000 polygons into a topology. I use TopoGeo_AddPolygon and separate transactions for each area to avoid any issues with a single long running transaction and as the significant time spent is in TopoGeo_AddPolygon anyway.
In the resulting top list of statements with most time spent at third and fourth place came the following statements which I found suspicious:
UPDATE topo.edge_data SET next_right_edge = ?, abs_next_right_edge = ? WHERE edge_id != ? AND next_right_edge = ?
UPDATE topo.edge_data SET next_left_edge = ?, abs_next_left_edge = ? WHERE edge_id != ? AND next_left_edge = ?
I noted that next_right_edge and next_left_edge are not indexed in edge_data and conclude that these updates must be triggering sequential scans of edge_data. Adding indexes results in a very significant performance increase and from what I can tell a performance curve with diminishing increases in time per object loaded.
Attachments (3)
Change History (7)
comment:1 by , 10 years ago
by , 10 years ago
by , 10 years ago
by , 10 years ago
comment:2 by , 10 years ago
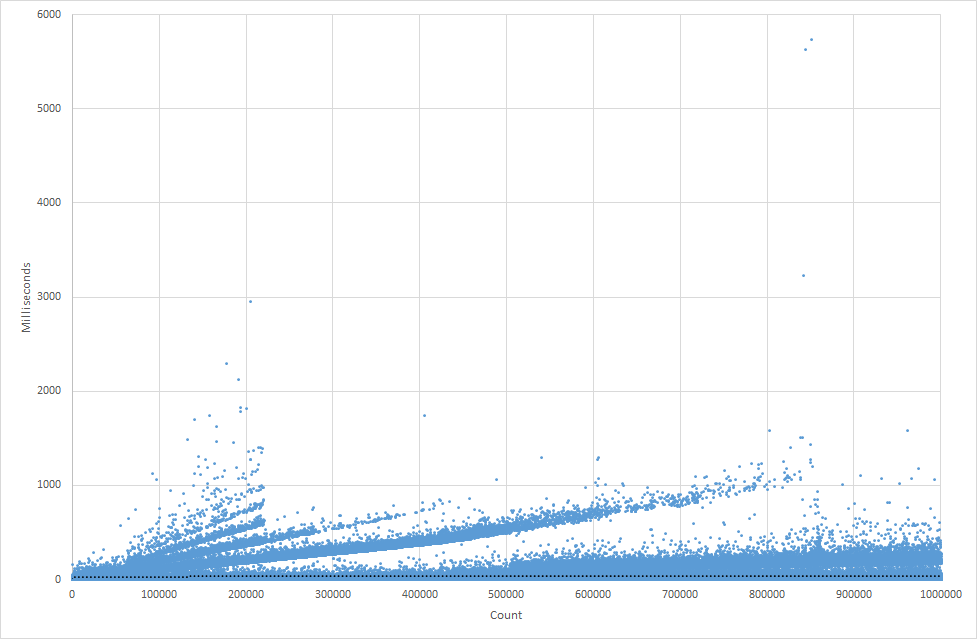
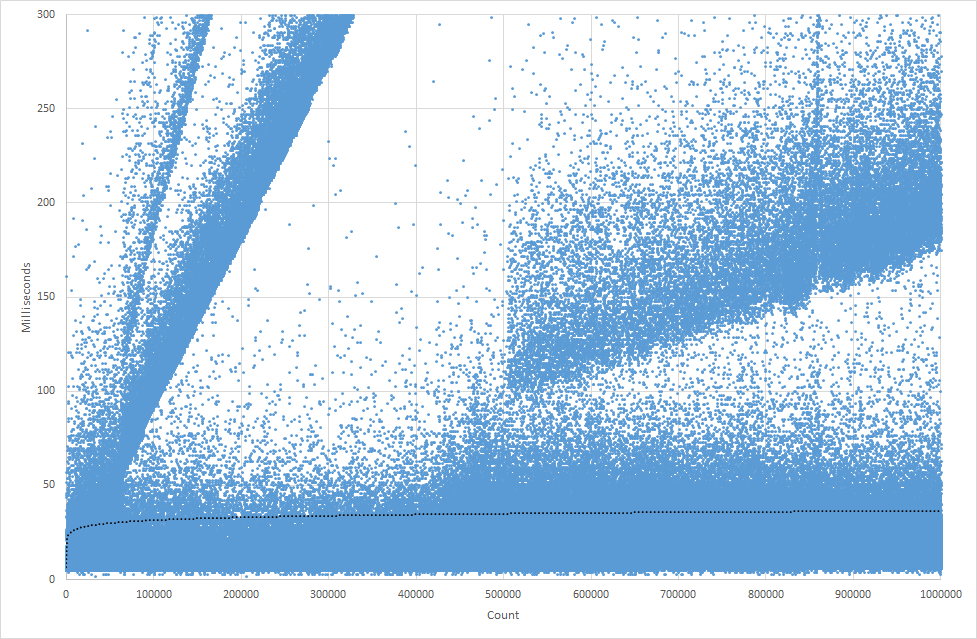
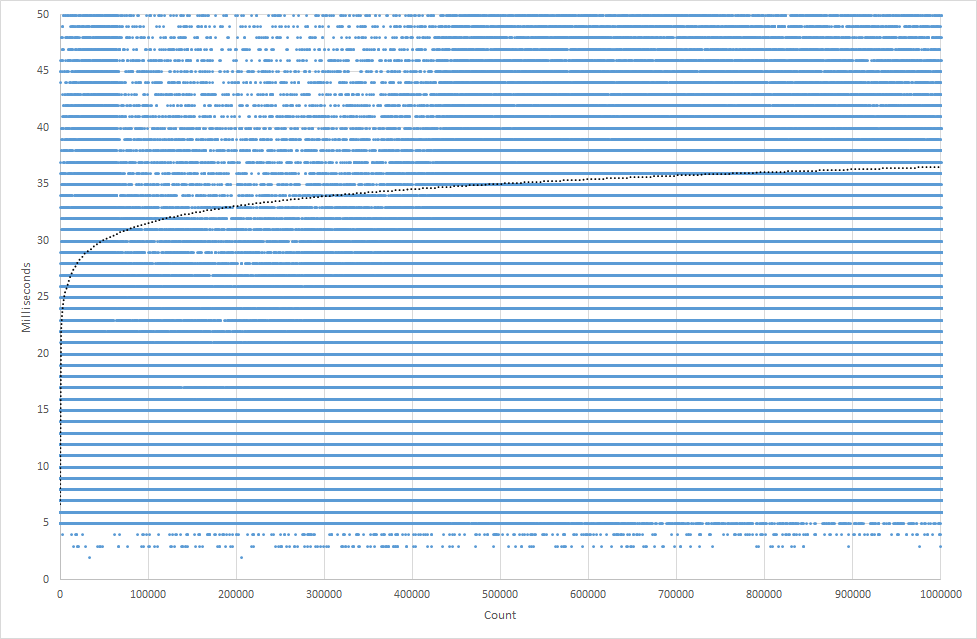
Added some diagrams plotting time to load, per polygon, one million polygons into a topology. The whole process of loading ~1,3 million polygons took ~24h. This is after adding the indexes as described in this ticket, without the indexes I gave up loading this many polygons.
Diagrams are named after max milliseconds displayed. Some funny patterns emerge when looking at max 6000 or 300 ms which I think is related to my input data. The max 50 ms diagram shows a logarithmic trend line clearly.
comment:4 by , 10 years ago
| Resolution: | → duplicate |
|---|---|
| Status: | new → closed |
Patch created here: https://github.com/postgis/postgis/pull/30