
Opened 6 years ago
Closed 6 years ago
#3609 closed defect (fixed)
g.gui.timeline does not show granularity of time series
| Reported by: | veroandreo | Owned by: | |
|---|---|---|---|
| Priority: | normal | Milestone: | 7.6.0 |
| Component: | wxGUI | Version: | svn-trunk |
| Keywords: | g.gui.timeline, granularity | Cc: | |
| CPU: | Unspecified | Platform: | Linux |
Description
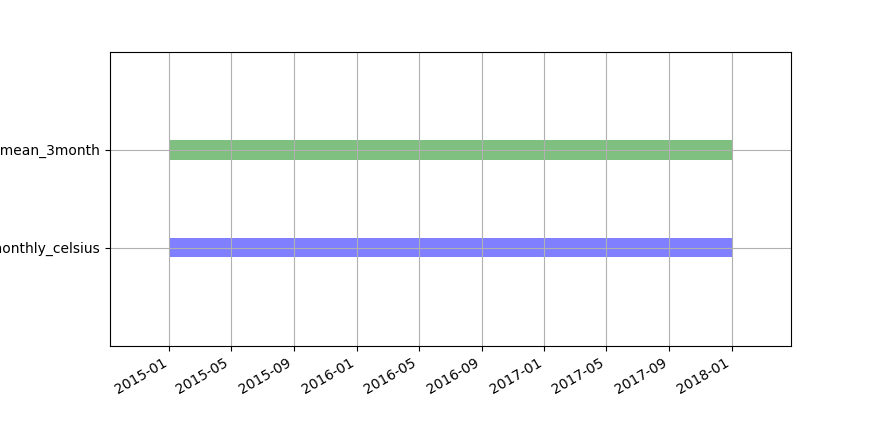
G7:g.gui.timeline used to show not only temporal extent of STDS but also their granularity (See manual page for old screenshots). I cannot precise starting when, but now, it does not display different granularities.
See attachment, the STDS above has 3-month granularity and the one below is monthly data. They are graphically indistinguishable, which makes g.gui.timeline kinda obsolete.
I use grass trunk r73007 in Fedora 28.
Attachments (3)
Change History (10)
by , 6 years ago
| Attachment: | g.gui.timeline_no_granularity.png added |
|---|
comment:2 by , 6 years ago
by , 6 years ago
| Attachment: | g.gui.timeline_example.png added |
|---|
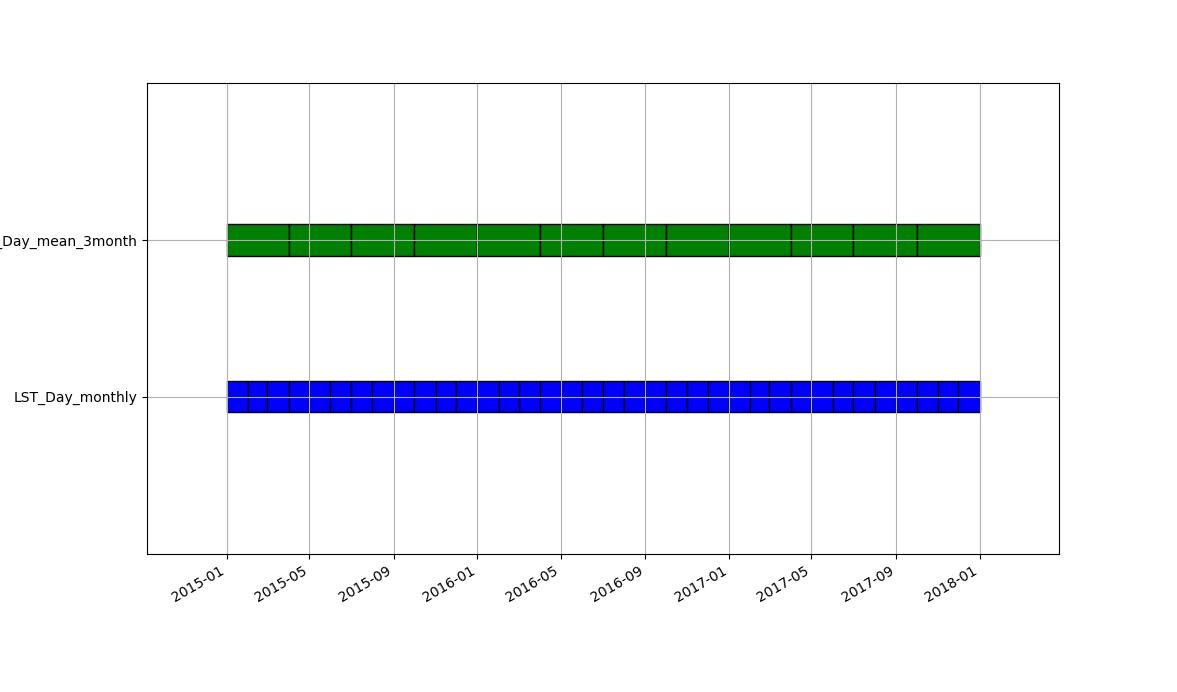
g.gui.timeline example after the fix, plot grid creates visual confusion with granularity
follow-up: 4 comment:3 by , 6 years ago
Seems to be because it was semitransparent, I disabled that in r73020.
comment:4 by , 6 years ago
by , 6 years ago
| Attachment: | g.gui.timeline_testing_r73020.png added |
|---|
g.gui.timeline: timeline plot for testing r73020, still the same confusing effect of the plot grid
comment:6 by , 6 years ago
Note:
See TracTickets
for help on using tickets.
g.gui.timeline example where granularity of STRDS is not evident as it used to be