Opened 5 years ago
Last modified 4 years ago
#2449 closed task
Setup Grafana and Prometheus for monitoring of servers — at Version 2
| Reported by: | robe | Owned by: | |
|---|---|---|---|
| Priority: | normal | Milestone: | Sysadmin Contract 2020-I |
| Component: | SysAdmin | Keywords: | |
| Cc: |
Description (last modified by )
When I killed off the old osgeo3, I made all the munin-nodes no longer useful.
I started to setup a new munin -- but couldn't get it to work -- which got me thinking maybe there is something better anyway.
Long story short -- after accidentally stumbling on some videos about Matrix, I came across a combination of using Prometheus with Grafana and it ended up surprisingly easy to install.
I've only installed nodes so far on the newer servers on osgeo3 and started to do it on osgeo7.
The web interface for the monitoring is at
and authentication is via our LDAP.
I'm going to try installing a node exporter on tracsvn next.
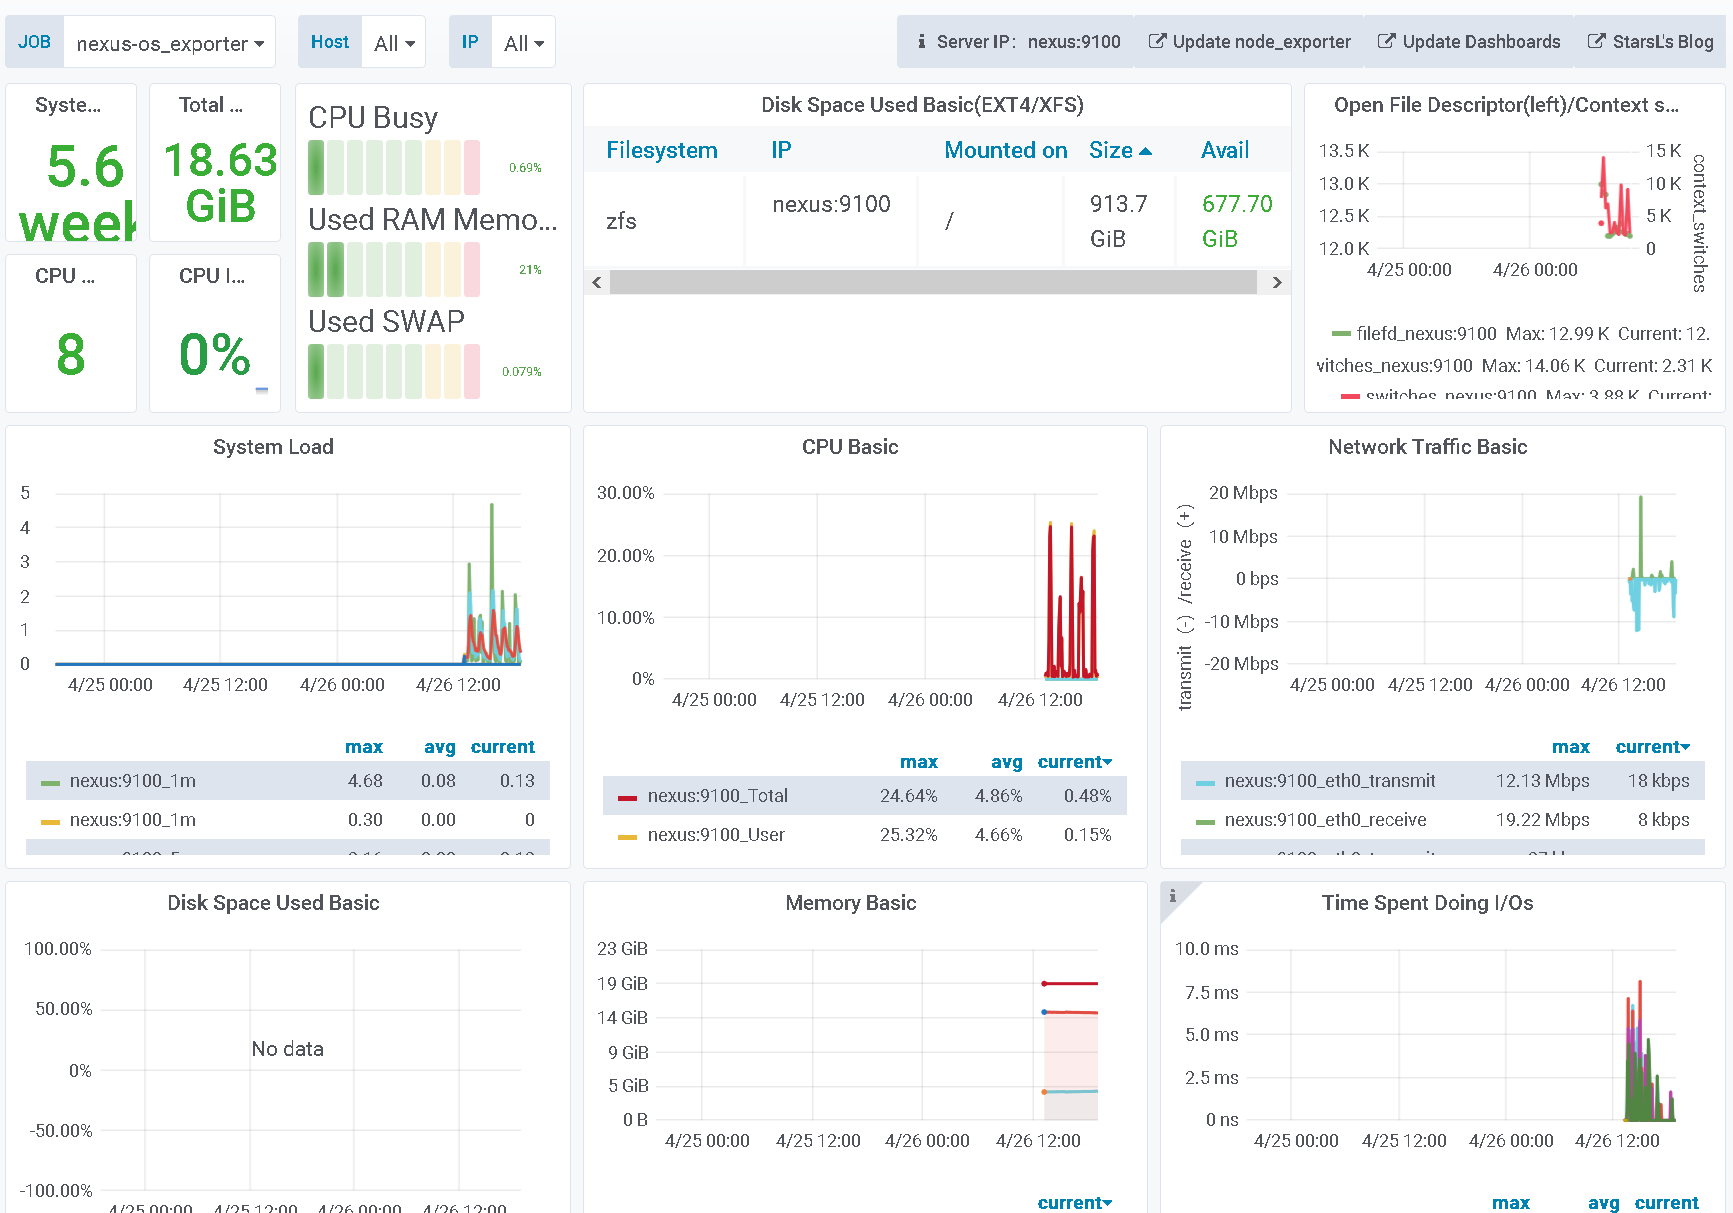
Attached is a sample chart in Grafana for nexus container
Change History (3)
by , 5 years ago
| Attachment: | nexus-chart.png added |
|---|

comment:2 by , 5 years ago
| Description: | modified (diff) |
|---|
sorry type in url - it's https://monitor.osgeo.org