
Opened 18 years ago
Last modified 17 years ago
#1800 closed enhancement
Add dynamic charting capabilities to mapserver — at Version 10
| Reported by: | Owned by: | dmorissette | |
|---|---|---|---|
| Priority: | high | Milestone: | |
| Component: | MapServer C Library | Version: | unspecified |
| Severity: | minor | Keywords: | |
| Cc: | mapserver@…, thomas.bonfort@…, sdlime |
Description (last modified by )
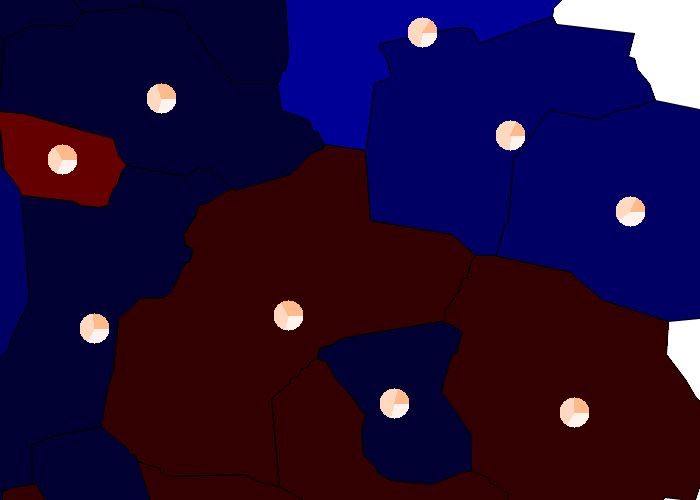
In order to output thematic maps, dynamic charting features in mapserver would be nice to have in mapserver. Such charts could include pie charts or bar graphs, for example.
Change History (14)
by , 18 years ago
| Attachment: | chart.diff added |
|---|
comment:1 by , 18 years ago
the proposed patch:
- adds a new layer type, namely "CHART"
- implements simple pie charts from values taken from the SIZE or SIZEITEM
values of each class belonging to the layer

open questions:
- the chart type (pie, bar, ...) and the size of each chart are specified in
PROCESSING attributes, even if only PIE types are implemented. maybe specific
attributes should be defined.
- the values of each class are  taken from the size/sizeitem of the
corresponding STYLE, which is semantically awkward.
- should the drawn charts be considered as labels or symbols, and cached to
avoid overlap?

an example of such a layer is:

LAYER
	NAME "ages"
	TYPE CHART
      CONNECTIONTYPE postgis
      CONNECTION "blabla"
      DATA "the_geom from demo"
	PROCESSING "CHART_TYPE=pie"
	PROCESSING "CHART_SIZE=30"
      STATUS ON
      CLASS
           NAME "population age 0-19"
          STYLE
		SIZEITEM "v1006"
		COLOR 255 244 237
	END
      END
      CLASS
          NAME "population age 20-39"
          STYLE
		SIZEITEM "v1007"
		COLOR 255 217 191
	END
      END
      CLASS
          NAME "population age 40-59"
          STYLE
		SIZEITEM "v1008"
		COLOR 255 186 140
	END
      END
 END

note that the values "v1006" etc... aren't scaled to a specific value
comment:2 by , 18 years ago
| Cc: | added |
|---|
comment:3 by , 18 years ago
| Cc: | added |
|---|
comment:4 by , 18 years ago
| Cc: | added |
|---|
comment:5 by , 18 years ago
I had a quick look at the patch and it seems to be missing the
msDrawChartLayerGD() function. Do you already have code to render charts? How do
you plan to do the rendering?

Doing basic pie charts is simple, but when it comes to other chart types and
properly labelling the values/axis or doing 3-d effects then it quickly becomes
more involved. There are already a few libs for rendering charts. Ideally we
should see if it's possible to reuse an existing chart rendering lib, that would
give us more powerful charting without having to reimplement everything ourselves.
comment:6 by , 18 years ago
OWTChart is just a CGI wrapper around the gdchart library, which is where all
the chart rendering logic is located. Since the original gdchart library was too
messy to be usable, the OWTChart package includes a gdchart2 directiory which is
an adapted version of gdchart with most of the portability issues fixed. It
takes a struct with the chart config details as input and draws the chart to a
gdImage.

I think it would be possible to use the gdchart2 sub-directory from MapServer,
but then we'd need to package and maintain gdchart2 as a new package and I'm not
sure if that's worth the investment.

I was kind of hoping that there might be another C/C++ lib that has more life
around it and that could be used as an alternative, but I do not have any
pointer to offer at the moment.

All this being said, since you already have the code working then I do not have
a strong objection to using your code instead of a specialized lib.
comment:7 by , 17 years ago
| Status: | new → assigned |
|---|
Dan: Have you installed and tried this out? I plan to this week...

Steve
comment:8 by , 17 years ago
rendering of small diameter arcs in gd is /horrible/ , especially with
even-sized diameters.
I'll work on the equivalent with imagemagick/agg when/if they are incorporated
with ms
comment:10 by , 17 years ago
| Cc: | added |
|---|---|
| Description: | modified (diff) |
| Owner: | changed from to |
| Status: | assigned → new |
I have created MS RFC 29 for this:
by , 17 years ago
| Attachment: | bug1800.patch added |
|---|
Patch updated to work with current (4.99) SVN trunk
Note:
See TracTickets
for help on using tickets.
intial functionnality for pie charts