
| Version 26 (modified by , 14 years ago) ( diff ) |
|---|
How-To Test GRASS6
Scope of this page
This pages is intended to users and developers who want to test a GRASS installation (test protocol). As side effect, you can also showcase GRASS 6 using these commands.
Note: see here for a first time user's mini-intro.
Table of Contents
- Scope of this page
- Requirements
- Start of the program
- Re-launch of GUI from command line
- Using gis.m TclTk graphical user interface
- Using wxPython graphical user interface
- Display various maps in classical GRASS monitor
- 3D visualization with NVIZ
- Simple raster analysis
- Simple vector analysis
- Using QGIS' GRASS toolbox
- See Also
Requirements
- GRASS 6 installation (source code and binaries download)
- Educational data set: OSGeo Educational data set North Carolina: data and description.
Extract the NC sample data set for GRASS:
mkdir $HOME/grassdata
tar xvfz nc_spm_latest.tar.gz
Start of the program
GRASS 6 is started either from the menu (if installed therein) or from command line. In all cases, select mapset "user1".
# show available options
grass64 --help
Expected result: the help text should be shown.
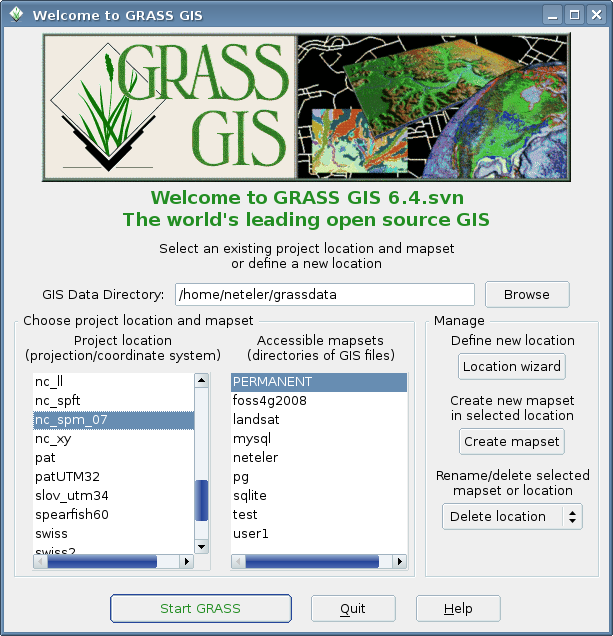
# start with current Tcl/Tk based graphical user interface (gis.m)
grass64 -tcltk

# start with wxPython based graphical user interface
grass64 -wxpython
Expected result: the selected graphical user interface should come up.

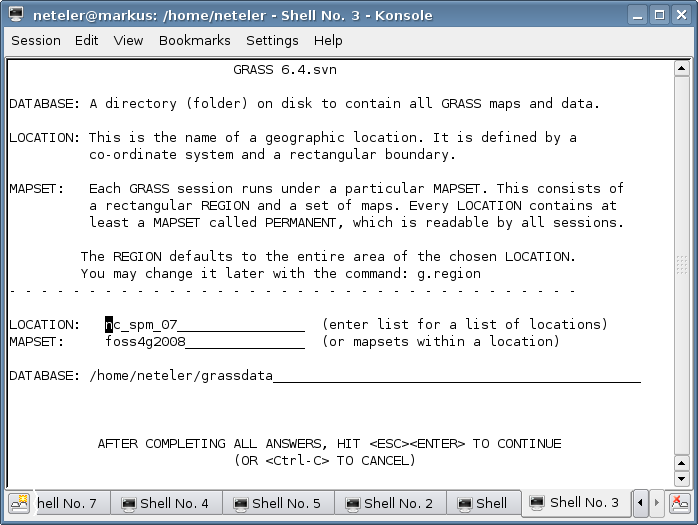
# start with text based interface
grass64 -text
Expected result: the text user interface should come up.

Re-launch of GUI from command line
# start with current Tcl/Tk based graphical user interface (gis.m)
g.gui tcltk

# start with wxPython based graphical user interface
g.gui wxpython
Expected result: the selected graphical user interface should come up.
Using gis.m TclTk graphical user interface
- To add a raster map, click in GIS manager on "Add raster layer" button,
- Click on word "raster1" which appears in the canvas to enable in the lower part the raster map tool (should already be there)
- In "Display raster maps", select "Base map" button, explode "PERMANENT" mapset, and select map "elevation" (click ok or use double click on map name)
- The map name should have appeared in canvas
- Get second "Map Display 1" window on top, therein click on "Display active layer" button (most left): it should display the elevation map.
- Try to zoom (open with left mouse button a zoom box)
- Create a profile ("Create profile" button)
- In "Profile window" tool, use left button to select raster map gaina ("elevation" in PERMANENT)
- Click "Draw profile transect" to draw a transect in the main map window
- Click "Draw profile" button to draw it. Each transect turn is indicated as vertical line in the profile.
- To add a vector map, click on the "Add vector layer" button
- Click on word "vector1" which appears in the canvas to enable in the lower part the vector map tool (should already be there)
- In "Display vector maps", select "Vector map" button, explode "PERMANENT" mapset, and select map "roadsmajor" (click ok or use double click on map name)
- The map name should have appeared in canvas
- Get second "Map Display 1" window on top, therein click on "Display active layer" button (most left): it should display the elevation map.
Expected result: it should just work.
Using wxPython graphical user interface
Basic map display
- Click in Layer manager on "Add raster map" button,
- select raster map "elevation@PERMANENT" in properties dialog and click "ok",
- right mouse click in layer tree and choose from contextual menu "Zoom to selected map", map should appear in canvas.
- Try to zoom, to create a profile etc.
Expected result: it should just work.
Digitizing
- In the Layer manager click on "Add raster map" button,
- Select raster map "elev_lid792_1m@PERMANENT" in properties dialog and click "ok",
- Right mouse click in layer tree and choose from contextual menu "Zoom to selected map", map should appear in canvas.
- In the Layer manager click on "Add raster map" button again,
- Select raster map "ortho_2001_t792_1m@PERMANENT" in properties dialog and click "ok",
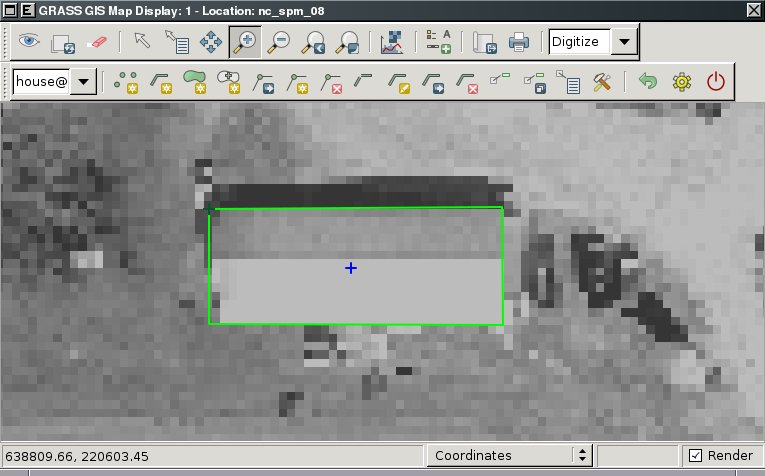
- Zoom to houses within the map, zoom one house,
- On the right-hand end of the map canvas window select "Digitize" from the pull-down list. (originally set to "2D view")
- Go to "Select vector map" -> "New vector map", enter "house" as vector map name, "ok".
- Go into the layer manager canvas and click the "Show attribute table" icon,
- Therein go into the "Manage table" tab and add a new column "name" as varchar type with length 50. Then "Add", then "Quit" to close the Attribute Manager.
- Now digitize a boundary around the house and a centroid, for both enter "my home" as "name" attribute.
- Leave the digitizer by going back to "2D view". The house polygon should show up as grey area.
")
Extrude 2D vector to 3D vector
- Go in the layer manager canvas to "Vector" -> "Develop vector map" -> "Extrude 3D vector map".
- Have the "house" vector map selected, insert "house3d" as new 3D map (Required tab)
- Go to "Optional" tab and activate "Trace elevation" to make the house bottom line follow the terrain and select "elev_lid792_1m@PERMANENT" as "Elevation map", and a height of 5 (meters), then "Run". This creates the 3D house vector block.
Display 3D house in NVIZ
Since the new NVIZ within wxPython doesn't yet support 3D vectors, we use the common TclTk NVIZ in the shell terminal:
  g.region rast=elev_lid792_1m -p
  nviz elevation=elev_lid792_1m color=ortho_2001_t792_1m vector=house3D
- Move the puck to change the viewpoint,
- increase the raster resolution in "Visualize" -> "Raster surfaces" -> "Resolution fine" to 1 (the smaller the number, the higher the resolution).

Display various maps in classical GRASS monitor
(NOTE: not for native winGRASS, but for Cygwin-winGRASS and Unix compliant installations)
As first step on the command line we set the current region to extent and resolution of the elevation raster map. Then we open a graphical map display ("GRASS monitor") and display the map:
g.region rast=elevation -p
d.mon x0         # MS Window users: use the display manager instead
d.rast elevation
d.vect roadsmajor
Expected result: GRASS monitor should open and show the selected maps
Display as shaded terrain map:
d.his i=elevation_shade h=elevation
d.vect roadsmajor

# set barscale position per mouse click into map:
d.barscale -mt
3D visualization with NVIZ
# raster map and 2D vector lines map
 nviz elevation vect=roadsmajor
# raster map and 2D vector lines map and 3D vector points
nviz elevation vect=roadsmajor points=precip_30ynormals_3d
Tests: navigate with the puck, interrogate map, etc. (ADD MORE)
Expected result: should not crash at all but show maps as expected
Simple raster analysis
Raster analysis comprises a lot of functionality.
Raster algebra
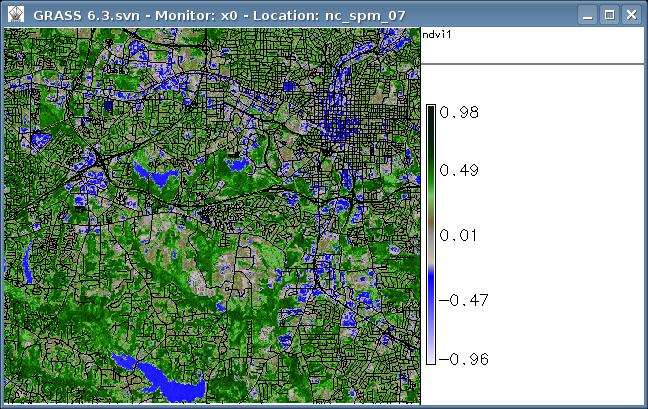
Normalized Differences Vegetation Index (NDVI) from LANDSAT-TM7:
# set current region/resolution to map:
g.region rast=lsat7_2002_40 -p
# display metadata:
r.info -h lsat7_2002_40
# generate NDVI:
r.mapcalc "ndvi = 1.0 *  (lsat7_2002_40 - lsat7_2002_30) / (lsat7_2002_40+ lsat7_2002_30)"
r.info -r ndvi
r.colors ndvi color=ndvi

# display 2D:
d.mon x0         # MS Window users: use the display manager instead
d.rast.leg ndvi
d.vect streets_wake
# display 3D:
nviz elevation col=ndvi vect=streets_wake
Expected results: the NDVI map should be colorized in near natural colors, see screenshot:

Raster statistics
Univariate statistics:
r.univar ndvi
Expected results: minimum: -0.956522, maximum: 0.978723, mean: 0.190006 etc.
Simple vector analysis
- TBD
Extracting from vector maps
- extract large streets from "streets_wake"
SQL support
g.region vect=schools_wake -p
d.erase         # MS Window users: use the display manager instead

# show all schools in Wake County
d.vect schools_wake col=red icon=basic/circle siz=5

# show a subset of all elementary schools in Raleigh
d.vect schools_wake where="ADDRCITY='Raleigh' and GLEVEL='E'"
Vector statistics
Univariate statistics:
# show available columns
v.info -c precip_30ynormals_3d
v.univar precip_30ynormals_3d col=annual type=point
Expected result: mean: 1289.31 etc.
Transfer raster slope to vector segments
- v.split, v.to.db
Shortest path routing
- NC bus routes... map "busroutesall"
Using QGIS' GRASS toolbox
Start "qgis" within GRASS shell.
- Go menu "Plugins, Pluginmanager, activate "GRASS plugin", OK button: a set of new buttons should appear
- click "Add GRASS raster layer" button, select "elevation" map
- click "Add GRASS raster layer" button, select "elevation_shade" map
- click right mouse button in legend on "elevation_shade" map, move transparency to 40%
- click "Add GRASS vector layer" button, select "roadsmajor" map, select layer "1-line" (level 1 is the topological level), OK
See Also
The following demos are related to the GRASS book, 3rd edition 2008 (based on NC data set):
Attachments (5)
-
nc_ndvi.jpg
(99.4 KB
) - added by 16 years ago.
North Carolina Raleight NDVI from Landsat
-
grass64_wx_start.png
(165.5 KB
) - added by 16 years ago.
screenshot
-
grass64_text_start.png
(56.1 KB
) - added by 16 years ago.
text startup
-
grass64_digitize.jpg
(58.6 KB
) - added by 14 years ago.
wxGUI digitizer (house)
-
grass64_nviz_3dhouse.jpg
(70.8 KB
) - added by 14 years ago.
wxGUI 3D view mode
Download all attachments as: .zip