
| Version 14 (modified by , 8 years ago) ( diff ) |
|---|
Complete basic cartography suite in GRASS GIS wxGUI Map Display
| Title: | Complete basic cartography suite in GRASS GIS wxGUI Map Display |
| Student Name: | Adam Laza, Czech Technical University in Prague |
| Organization: | OSGeo - Open Source Geospatial Foundation |
| Mentor Name: | Anna Petrasova, Vaclav Petras |
| GSoC proposal: | https://summerofcode.withgoogle.com/projects/#6052618879107072 view proposal] |
| Link to code: | TODO |
| Documentation: | TODO |
Brief description
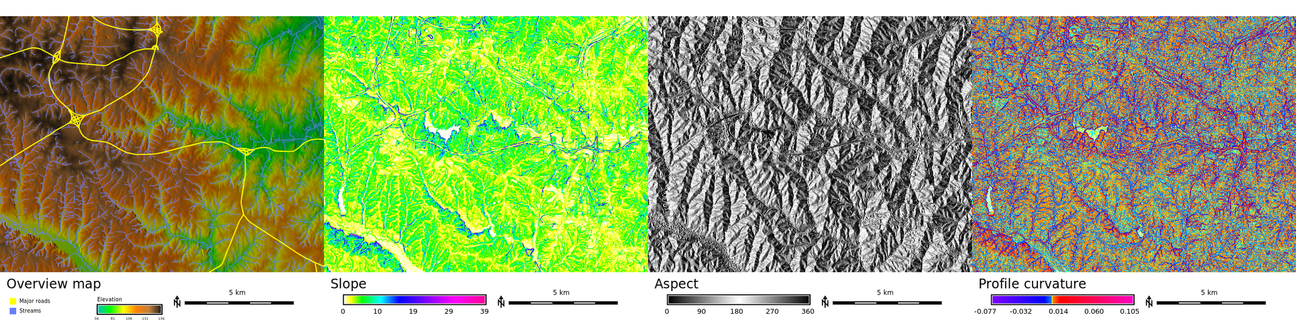
Currently a GRASS GIS user is forced to use Cartographic Composer or use another software (e.g. QGIS) to create hard copy map outputs with all features. The aim of this project is to develop complete basic cartography suite for the wxGUI Map Display so it could serve for most of the science publications. The goal is not to substitute QGIS Cart Comp or similar, it's just about completing all features so the cartography scripting abilities of GRASS GIS and its potential can be fully used.
State before GSoC
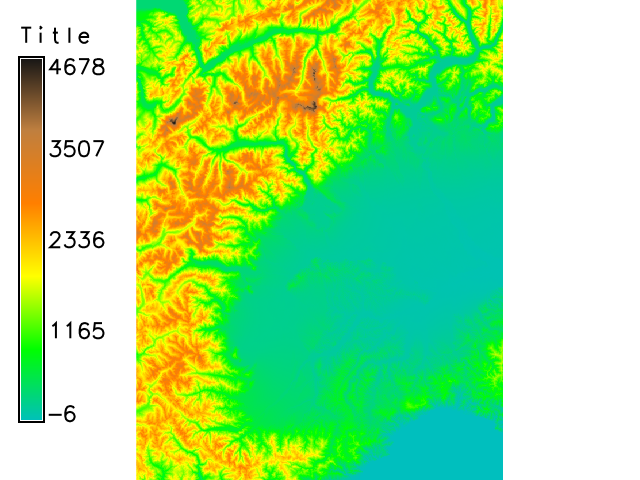
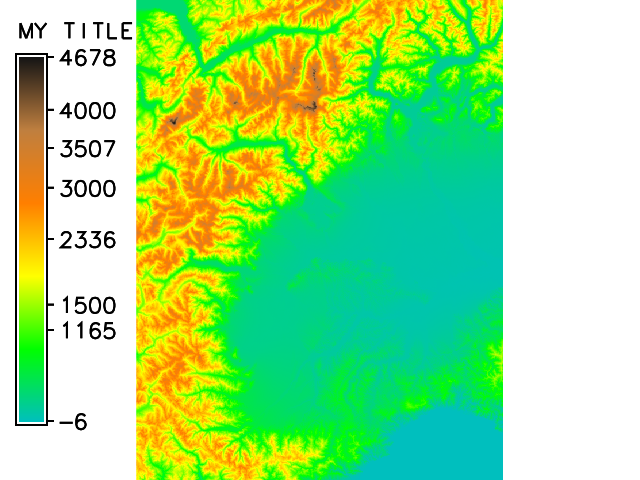
GRASS GIS contains some modules which would be good to implement into cartography suite for wxGUI Map Display. There are d.barscale, d.graph, d.histogram, d.legend and many other d.* commands to use. There are bugs in some of them and it needs to be fixed (options for map window size). Then there are some modules which need to be enhanced. Legend background is currently transparent > add an options for opacity, border and corner settings. It's possible to set number of breaks/ticks for legend but values are not rounded > add an option for manual brakes/ticks, add an option for automatic breaks/ticks (every ten, hundred).
Addition to the project
GRASS GIS is an important OSGeo project but it is perceived as not suitable for cartography which prevents a lot of users from utilizing as a GIS. Completing basic cartography suite in GRASS GIS should satisfy needs of significant part of potential user community. Moreover, GRASS GIS provides an easy way to automate simple map creation using scripting. However, only with complete suite of basic functions implemented in this GSoC project, the cartography scripting abilities of GRASS GIS can be fully used.
Project plan
The idea of the project is to start with easytoimplement stuff and stepbystep implement the more difficult ones. There are many details which need to be improved and many others which are missing entirely so the users have to use another software (legend background, north arrow orientation)
| Project plan | ||
| Date | Goals | status |
| MAY 23 | Starting GSoC | |
| MAY 23 - 27 | Store legend, scale bar, north arrow and text in workspace, bug fixing (e.g. workspace loading) (wxGUI). | |
| MAY 30 - JUNE 3 | Add units to legend (optionally also title) as parameter. Option for switch legend to linear/logarithmic scale. Manual/automatic breaks/ticks for legend (option for rounded values, option for every ten,hundred). | |
| JUNE 6 - 10 | Legend background (border, rounded corners, opacity settings) (d.legend, C).Support map units in scale bar (not only meters).Allow user to set the length of scale bar (in map units) (d.barscale). | |
| JUNE 13 - 17 | Possibility to add any image (as in animation tool). Use cases: logo/watermark, workaround for overview maps. | |
| JUNE 20 - 24 | General shapes. | |
| JUNE 20 - 27 | Midterm evaluations | |
| JUNE 27 - 1 JULY | General shapes. | |
| JULY 4 - 8 | Implement vector legend. Enhance d.vect.thematic. | |
| JULY 11 - 15 | Implement vector legend. Enhance d.vect.thematic. | |
| JULY 18 - 22 | Implement vector legend. Enhance d.vect.thematic. | |
| JULY 25 - 29 | Implement vector legend. Enhance d.vect.thematic. Testing, writing documentation. | |
| AUGUST 1 - 5 | Testing, writing documentation. | |
| AUGUST 8 - 12 | One week buffer in case of delay. | |
| AUGUST 15 - 23 | Submitting code and evaluations. | |
| AUGUST 23 - 29 | Final Evaluations | |
| AUGUST 30 | Ending GSoC | |
Tickets
We are using keywords cartography and gsoc2016 to mark the tickets which are tasks for this GSoC.
- #3024
- Add any image from a file to a map display
- #1242
- vector fills and line widths not displaying in latlon regions
- #2369
- Include map elements into GRASS workspaces
- #2494
- d.vect.thematic broken
- #2582
- please restore important thematic map features themetype, themecalc etc.
- #2714
- wish: logarithmic legend for raster maps
- #2838
- d.labels placement issue
- #3013
- support background and border for d.legend
- #3014
- Add ticks to continuous raster legend
- #3015
- Add legend title
- #3016
- Add option to set scalebar length
- #3017
- support for background option for grid labels in d.grid
- #3018
- Specify custom label for d.northarrow
- #3019
- Add other existing symbols to d.northarrow
- #3025
- support for color and background color in "Add text layer" from wx monitors
- #3031
- Rotate symbol for north arrow in d.northarrow
- #3044
- d.northarrow: transparent color does not work
- #3053
- d.grid: -n flag also disables text drawing
- #3076
- r.colors: parameter for scaling of values
- #3077
- r.colors: flag to output color table type and value range
- #3098
- problems with legend with categorical data and smooth gradient option
- #3099
- d.barscale: add support for LatLong locations
- #3106
- Transparent legend background does not work with categorical legend
- #3109
- d.grid: more enhancements
- #3122
- d.legend.vect: possibility to change text of displayed labels and select labels to show/not show
- #3123
- d.legend.vect: wrong handling of spaces in legend_label
- #3124
- d.northarrow incosistent placement when rendering to file/screen
- #3125
- d.legend.vect: take into account size_column/width_column in legend
- #3020
- Make N with arrow optional in d.barscale styles
- #3050
- Set size in d.northarrow
- #3081
- Add text after labels in d.legend
- #3082
- Multiply the label values in d.legend (0-1 to 0-100)
- #3029
- Add ps.map north arrows to d.northarrow
- #3051
- Allow image to be saved in Map Display even when there is no map
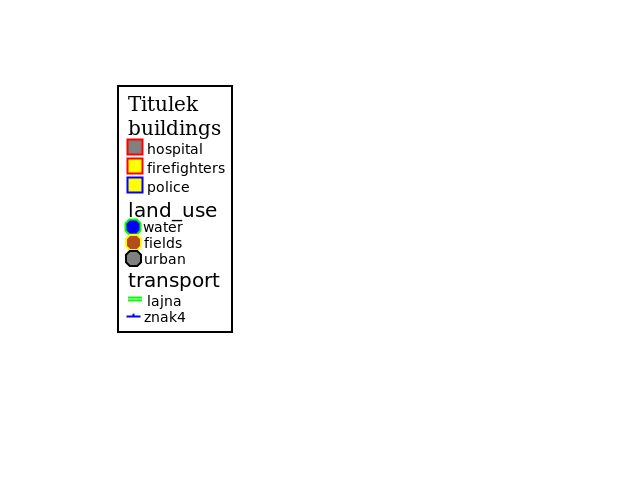
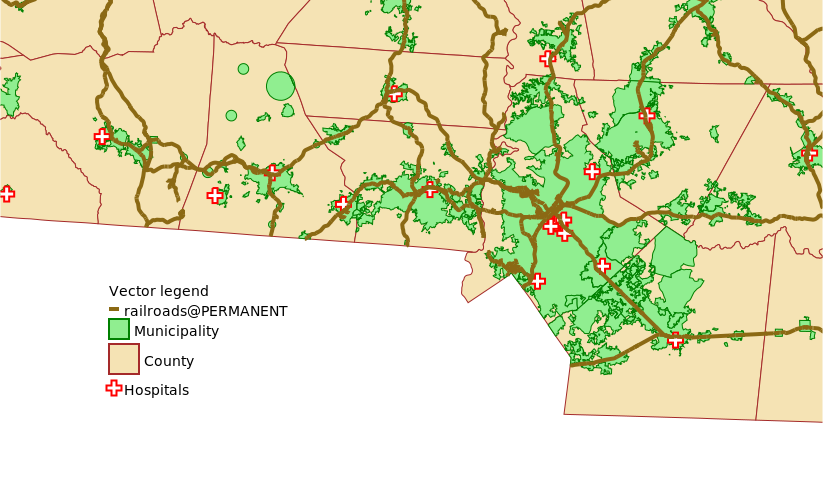
Vector legend
Draft of legend implementation. Please edit or change completely.
- 1st prototype
- d.legend.vector
- in: list of d.vect commands from layer manager
- Python
- extract: symbol color1 color2 size width text
- symbol
- symbols for lines and areas must be created
- icon if v.info returns lines, then use the new symbol for lines
- icon if v.info returns areas, then use the new symbol for areas
- use icon for points
- use icon when explicitly specified (there is a default but GUI does not put it there unlike history)
- if mixed feature types, either special symbols or separate entries or just use symbol (needs to be decided)
- color1=color
- color2=fill_color
- size=size
- width=width
- text=title or name
- symbol
- generates d.graph file
- GUI takes d.vect commands, calls this module and uses the output in d.graph when rendering
- 2nd stage
- text format for customization
symbol color1 color2 size width text...legend/lines_zred none 5 2 State border
G7:d.graph code:
color red
polygon
10 10
10 20
20 20
20 10
color black
move 22 10
size 24 24
text Red area
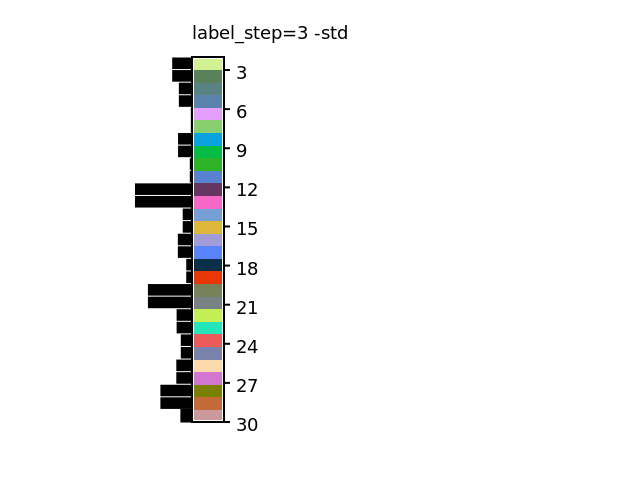
See for example: source:grass-addons/tools/std_dataset_display.py and the resulting image.
Development
Weekly reports
Bounding period
Bounding period, April, 22 - May, 22
I got in touch with my mentors. We discussed some possibilities for development. I installed Ubuntu, GRASS and QtCreator on my laptop. I got little bit stucked with QtCreator Debugger, but with my mentors help it works now. I looked at the bug #2494 and did a little research on it. I fixed the bug #2436. X-axis ticks labels now work in d.histogram.
Week 1
Week 1, May, 23-27
- What did you get done this week?
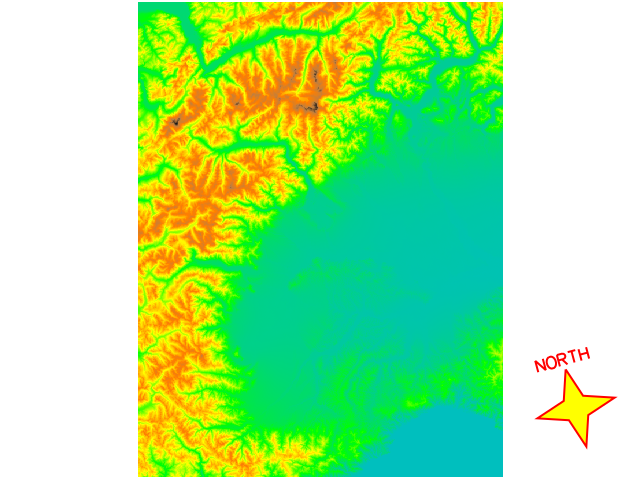
I worked on the module d.northarrow. I solved the ticket #3018 and added option for custom north-arrow label. I solved the ticket #3019 and added more north-arrow symbols. I solved the ticket #3031 and added option for north-arrow symbol rotation. I fixed the bug #1242 module now works in Lat-Long projection too but I need discuss the solution with my mentors.
d.mon cairo=northarrow.png
d.rast map=srtm
d.northarrow style=star rotation=15 label=NORTH color=red fill_color=yellow at=90,15

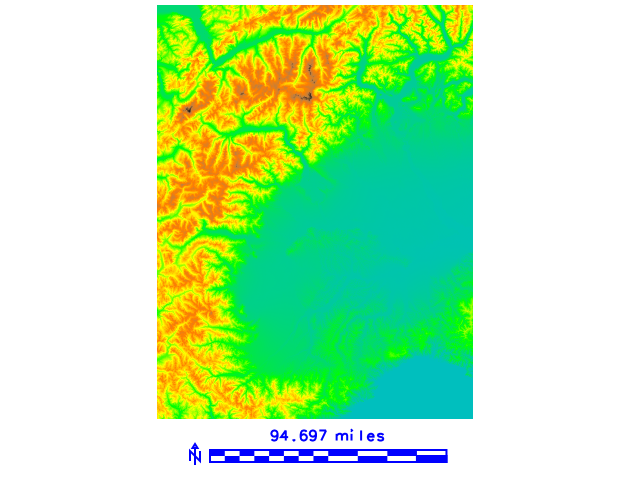
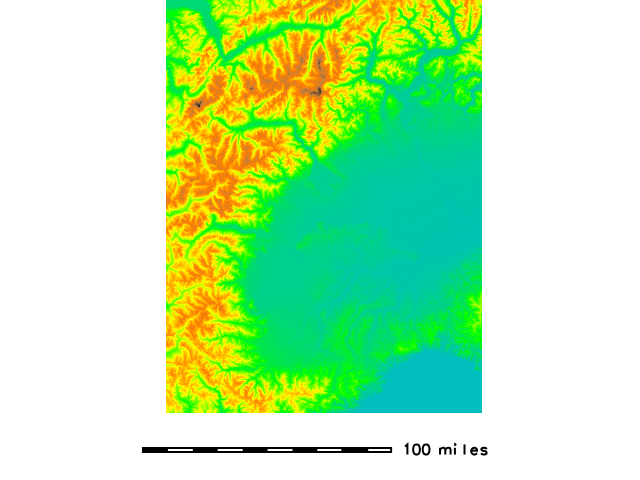
I worked on the module d.barscale. I solved the ticket #3016, added option length for custom barscale size, option segment for setting number of segments of barscale, added flag -u to display full unit name/only symbol. I need discuss the solution with my mentors. I solved the ticket #3020 and added flag for displaying a capital N with a simple arrow over it next to the barscale.
d.mon cairo=barscale.png
d.barscale style=part_checker length=500000 segment=8 color=blue text_position=over -unf

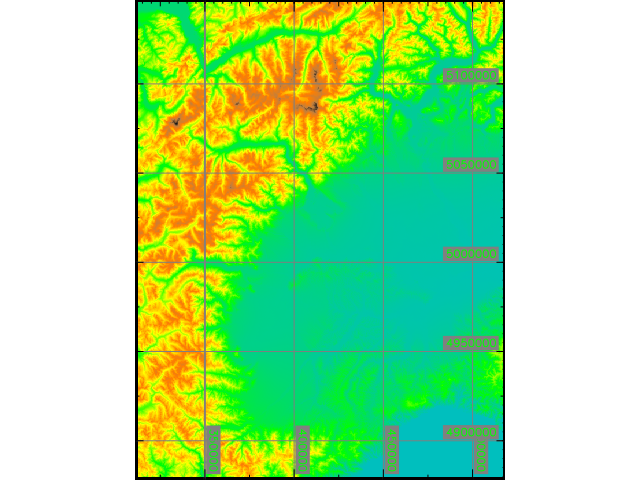
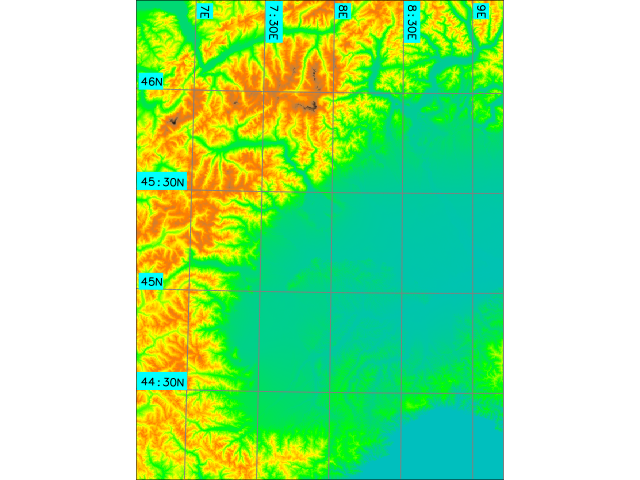
I worked on the module d.grid. I solved the ticket #3017 and added option to choose background color of grid labels.
d.mon cairo=barscale.png
d.grid size=50000 text_color=green bg_color=gray

- What do you plan on doing next week?
Next week I want to continue with others d.* modules and look on d.text and d.vect modules.
- Are you blocked on anything?
I don't think I am blocked on anything but I work in slow pace because all d.* modules are written in C which I have few experience with.
Attachments (15)
- northarrow.png (229.0 KB ) - added by 8 years ago.
- barscale.png (180.7 KB ) - added by 8 years ago.
- grid.png (231.9 KB ) - added by 8 years ago.
- grid.2.png (233.1 KB ) - added by 8 years ago.
- barscale.2.png (179.4 KB ) - added by 8 years ago.
- title.png (237.5 KB ) - added by 8 years ago.
- legend_ticks.png (242.8 KB ) - added by 8 years ago.
- d_legend_custom_labels_and_background.png (137.2 KB ) - added by 8 years ago.
- d_legend_logarithmic.png (150.9 KB ) - added by 8 years ago.
-
map.png
(14.7 KB
) - added by 8 years ago.
First version of vector legend
- slope.png (16.6 KB ) - added by 8 years ago.
- step.png (10.8 KB ) - added by 8 years ago.
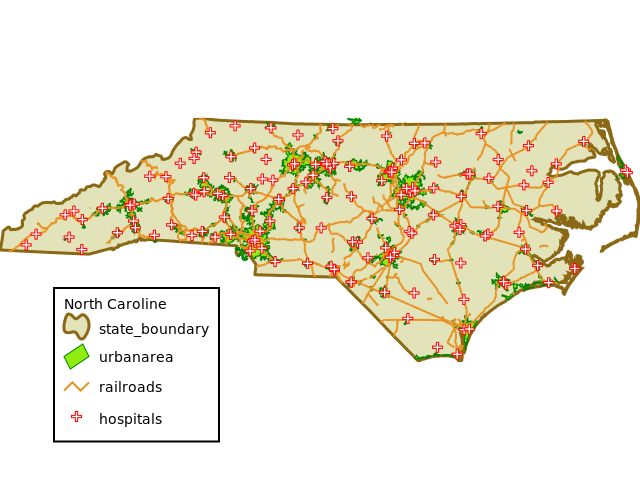
- vector_leg.png (179.6 KB ) - added by 8 years ago.
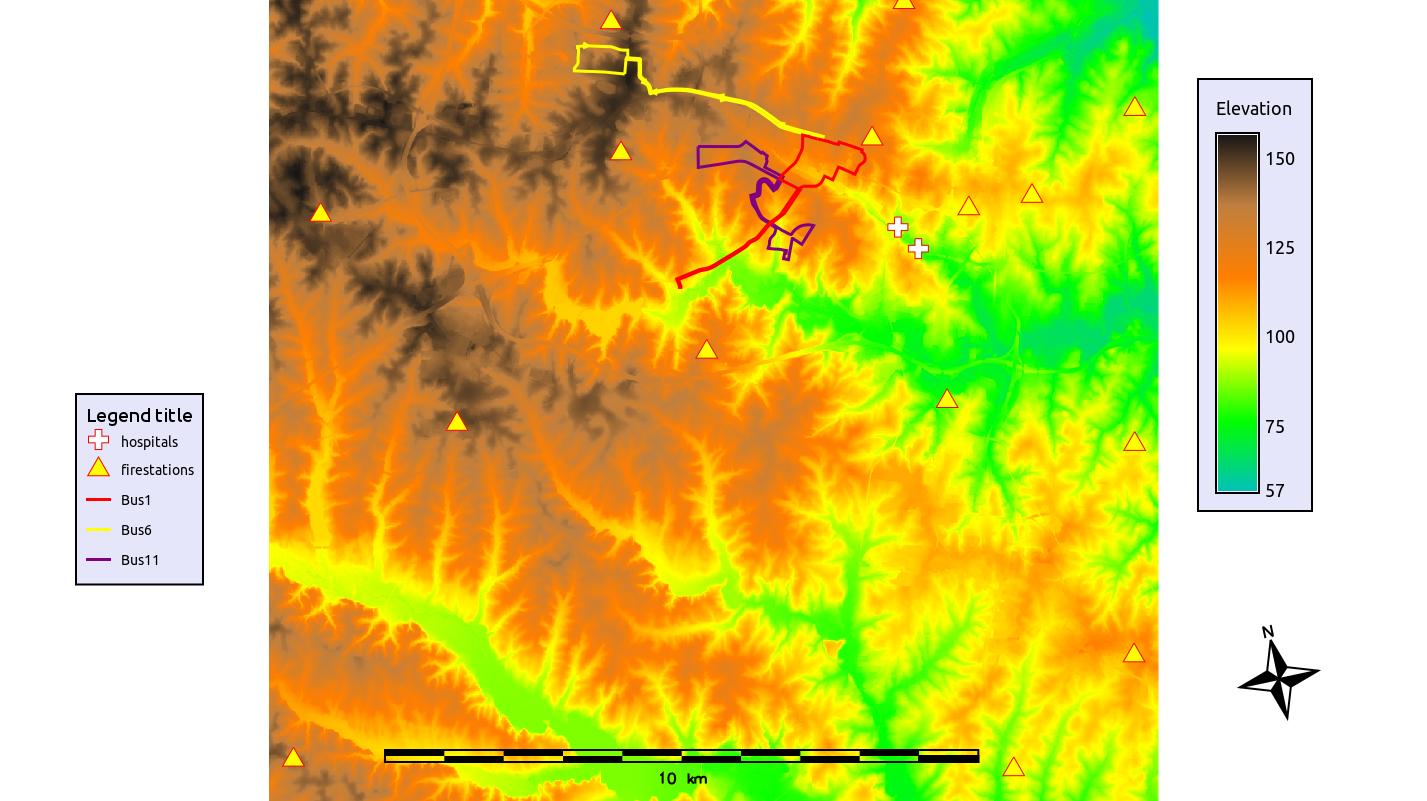
- d.legend.vect.png (112.2 KB ) - added by 8 years ago.
- map_GRASS2.jpg (118.9 KB ) - added by 8 years ago.