
Opened 15 years ago
Last modified 8 years ago
#510 new defect
bad display in the Output window for r.report and r.stats with aspect maps.
| Reported by: | clerici | Owned by: | |
|---|---|---|---|
| Priority: | major | Milestone: | 6.4.6 |
| Component: | Tcl/Tk | Version: | 6.4.0 RCs |
| Keywords: | gronsole.tcl buffer overrun | Cc: | |
| CPU: | Unspecified | Platform: | All |
Description
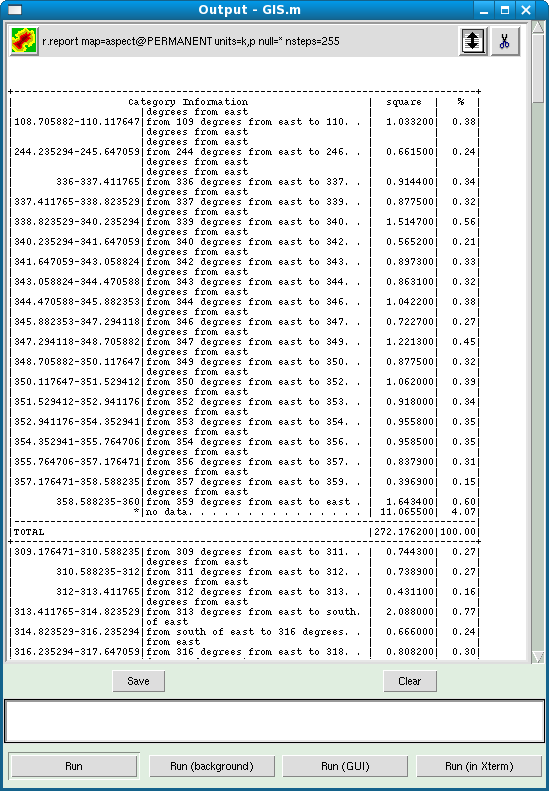
r.report and r.stats for aspect maps produce ordered tables if saved in a file but randomly disordered if displayed in the Output window.
In detail:
1) r.report for aspect map in Spearfish gives always bad (and different) results as reported in the attachment N.1
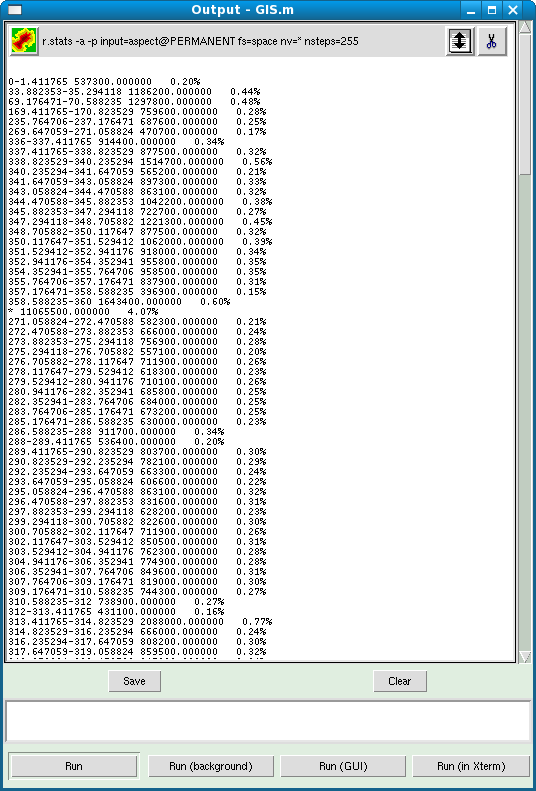
2) r.stats has a random behaviour as usually displays correct results, but sometimes the table is incorrect as in the example of the attachment N.2
No problem with GRASS6.3.
Greetings Aldo Clerici
Attachments (2)
Change History (9)
by , 15 years ago
| Attachment: | attN.1.png added |
|---|
by , 15 years ago
| Attachment: | attN.2.png added |
|---|
comment:1 by , 15 years ago
follow-up: 4 comment:3 by , 15 years ago
Replying to hamish:
can anyone else reproduce this?
No for r.report, but yes for r.stats (both in gis.m, not on the command line). There seems to be a serious sorting issue with the r.stats output in the Output windows of gis.m. The output is not missing any lines, but these lines show up later.
Maybe an issue of speed of output and redirection to the output window ?
Moritz
comment:4 by , 15 years ago
| Component: | default → Tcl |
|---|---|
| Platform: | Linux → All |
Replying to hamish:
can anyone else reproduce this?
Replying to mlennert:
No for r.report, but yes for r.stats (both in gis.m, not on the command line). There seems to be a serious sorting issue with the r.stats output in the Output windows of gis.m. The output is not missing any lines, but these lines show up later.
Maybe an issue of speed of output and redirection to the output window ?
ah, yes. I can reproduce it from both modules in gis.m (both linux/latest 6.5svn and wingrass 6.4.0svn native installer), and d.m on linux.
it looks fine from the wxPython GUI in Wingrass.
Hamish
comment:5 by , 15 years ago
I can replicate this too with r.stats. It seems to happen if you have a lot of data. The gronsole.tcl is fairly mysterious code in places. My only guess is that this output window was not designed to handle that much data coming in at once and the formatting lags the data stream.
Michael
comment:6 by , 12 years ago
| Keywords: | gronsole.tcl buffer overrun added |
|---|
comment:7 by , 8 years ago
| Milestone: | 6.4.0 → 6.4.6 |
|---|
I can't replicate the badly sorted r.report output, either from GIS.m or the command line.
Note that your r.stats result is missing some lines too, it seems to skip from 1.4% to 33%. Here I get the continuous set:
the only problem I see is that there is too much whitespace after the "#|description" in the header for FP range mode.
So I'm not sure what's wrong at your end.
Hamish