
Opened 8 years ago
Last modified 6 years ago
#3055 new defect
Revise monochromatic color tables
| Reported by: | wenzeslaus | Owned by: | |
|---|---|---|---|
| Priority: | blocker | Milestone: | 8.0.0 |
| Component: | Display | Version: | unspecified |
| Keywords: | r.colors, d.rast, blues, greens, oranges, reds, sepia, water | Cc: | |
| CPU: | Unspecified | Platform: | Unspecified |
Description
The monochromatic color tables namely blues, greens, oranges and reds added in r64283 start with white. It is probably obvious that it is good that there is no black but I think that they also should not contain white.
Using r.mapcalc, r.colors, and r.colors.matplotlib (g.extension r.colors.matplotlib), you can try how the Matplotlib Blues, Greens, Oranges and Reds look like.
color=blues
map=m_$color
g.region cols=500 rows=300 n=-300 s=-600 w=0 e=500
r.mapcalc "$map = col() / 10 + 2 * cos(col() * 100)"
r.colors map=$map color=$color
color=Blues
map=m2_$color
g.region cols=500 rows=300 n=-600 s=-900 w=0 e=500
r.mapcalc "$map = col() / 10 + 2 * cos(col() * 100)"
r.colors.matplotlib map=$map color=$color
Also Moritz mentioned off-list that a quick look at Color Brewer shows that they use values such as:
255:255:229 for greens
255:247:236 for reds
You can notice that besides different start color Matplotlib uses also different end color. Our color versions end e.g. with 0:0:255 (called blue in GRASS) which is an arbitrary color based on its special position in the RGB model not on its optical or aesthetic features. For the technical part, the greens and blues does not show the waves on the right and in comparison with the Matplotlib versions it seems to me that even reds and oranges show less waves on the right.
I'm not sure how many color steps are needed for the Matplotlib colors. I used 6 but perhaps just 2 (start and end) are enough.
The sepia color table from r33163 actually starts with white, 0:0:0, and ends with (almost) black, 255:254:251, (or the other way around when you don't use -n), so that's not good I think. I'm usually not able to use it because of the black color. The gray scale image and the waves are good (these two look like good indicators, see #3043). So, I would just remove the stretch the current colors unless there is some good sepia color table source.
The sepia color table from r68464 (from r.lake) doesn't show a big gradient in gray scale (which might be good thing sometimes, but not now). However, there is some and I don't know how to change it while preserving other features especially the look which I think is really good here.
Note that changing these would be more serious change in behavior because your result is changed even if you explicitly specify what you want (which is not the case for change of default in #3043 where you just trust the default which is changed for your good).
Note also that a monochromatic color tables are candidacies for new default color table (#3043).
Attachments (2)
Change History (15)
by , 8 years ago
| Attachment: | mono_current_grey_mpl_grey.png added |
|---|
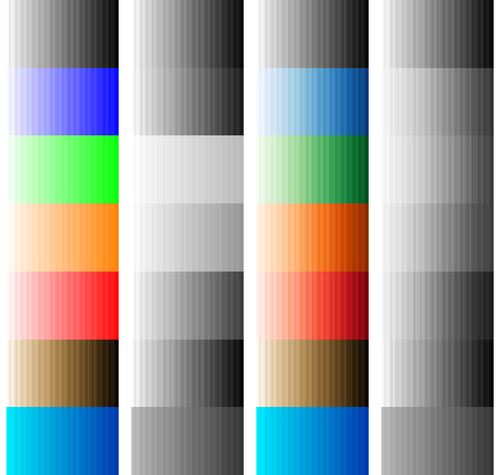
comment:1 by , 8 years ago
 - in grey scale - Matplotlib versions of Blues through Reds - in grey scale")
In column:
- grey
- blues
- greens
- oranges
- reds
- sepia
- water
In row: current state - current state in grey scale - b. g. o. r. from Matplotlib - again in grey scale
Raster:
r.mapcalc "map = col() / 10 + 2 * cos(col() * 100)"
by , 7 years ago
| Attachment: | monochromatic_to_matplotlib.diff added |
|---|
comment:4 by , 7 years ago
I don't have any strong feelings about my original ones (which were just quick hacks). I find that for some the contrast seems to stronger in my versions (blues for example), but I don't think we can find any one color scheme that would satisfy everyone for every usage. And I agree that not having white as the starting color is a good idea.
So, please go ahead and commit.
comment:6 by , 7 years ago
| Milestone: | 7.2.1 → 7.2.2 |
|---|
comment:9 by , 6 years ago
| Milestone: | → 7.2.4 |
|---|
follow-up: 13 comment:10 by , 6 years ago
| Milestone: | 7.2.4 → 8.0.0 |
|---|---|
| Priority: | normal → blocker |
As mentioned in the original description, it is a change of behavior, so it should wait for version 8 (and must be deiced before the release, so blocker).
follow-up: 12 comment:11 by , 6 years ago
Would be nice if custom color tables could be picked up from one or more user-defined directories that is refered to e.g. in an environment variable (lets say GRASS_CUSTOM_COLORS) That way, anyone can add institutioal or personal color tables, independent from the GRASS installation...
comment:12 by , 6 years ago
Replying to SBL:
Would be nice if custom color tables could be picked up from one or more user-defined directories that is refered to e.g. in an environment variable (lets say GRASS_CUSTOM_COLORS) That way, anyone can add institutioal or personal color tables, independent from the GRASS installation...
Makes sense, but please, create a separate ticket for this.
comment:13 by , 6 years ago
Replying to wenzeslaus:
As mentioned in the original description, it is a change of behavior, so it should wait for version 8 (and must be deiced before the release, so blocker).
Personally, I'm not sure that we need to be this strict with color tables which are only about visualization. I would say that targeting 7.6 as milestone would be acceptable.
Current color tables (grey, blues, greens, oranges, reds, sepia, water) - in grey scale - Matplotlib versions of Blues through Reds - in grey scale