
Opened 8 years ago
Closed 8 years ago
#3014 closed enhancement (fixed)
Add ticks to continuous raster legend
| Reported by: | annakrat | Owned by: | |
|---|---|---|---|
| Priority: | normal | Milestone: | 7.2.0 |
| Component: | Display | Version: | svn-trunk |
| Keywords: | d.legend, gsoc2016, cartography | Cc: | |
| CPU: | Unspecified | Platform: | All |
Description
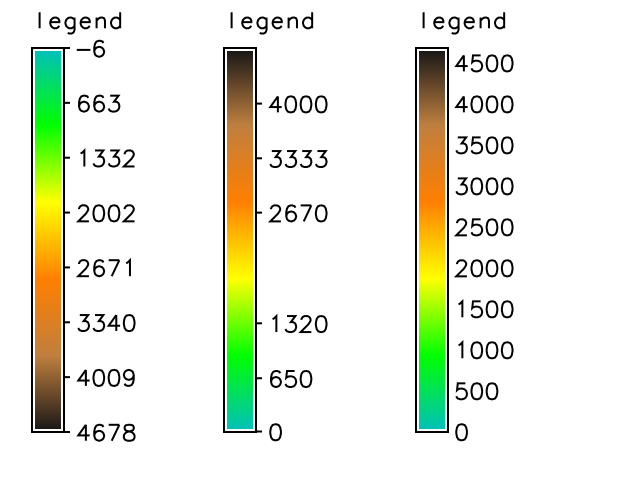
Continuous legend should have option to add ticks, so that it is easier to read. It would be good to have the option to add the tick numbers.
Attachments (3)
Change History (10)
follow-up: 2 comment:1 by , 8 years ago
comment:2 by , 8 years ago
Replying to lazaa:
Currently legend has ticks in regular intervals depend on
labelnum. The aim is to add option e.g.steps=100for display label every hundred orlabels_at=[list of values]to add one or more labels at specific values? (value would have to be min < label_at < max)
Start with drawing the tick marks based on labelnum. You should probably center the label at the tick.
If we want to further complicate it, there is couple of options. For example, we could have a parameter tick_value (or something similar) where user would specify values where to plot the ticks and labels.
Another option is to add tick_step which would create ticks based on the step. But the tick_start may be needed to know where to draw the first one.
comment:3 by , 8 years ago
I uploaded new patch and I added several new options. Option title to define custom title to display on the top of the legend.
d.legend raster=srtm title="Map legend"
An option tick_value to specify values where the ticks and labels will be displayed. Option labelnum is used to show only min and max.
d.legend raster=srtm labelnum=2 tick_value=1000,1848,2700,3500
Then option step to draw ticks and display labels at rounded values-values divisible by step value with rest 0. (Flag -c is used to hide labels generated from labelnum and to display only labels with defined interval.)
d.legend raster=srtm -c step=500
I've tested it for vertical/horizontal and normal/flipped legend it works fine. There's a problem with horizontal legend if user define more ticks then longer labels can overlap.
More testing welcome.
follow-up: 5 comment:4 by , 8 years ago
Thanks, I tested it and it works very well. I have couple of suggestions:
- if you compare the default before and after this change, the white border is now transparent, so that should be changed back. Also if you test categorical data, the black/white border is switched (inner is black, should be white). The current default legend size is wider than the previous one, that should be fixed as well.
- drawing ticks should be optional, implement for example '-t' flag. Question is if it should draw the ticks by default or not. Let's switch them off by default for now.
- the vertical centering of the labels and ticks is not quite perfect, I wonder if it could be improved
- I thought more about the names of the new parameters and decided
label_valuesandlabel_stepwould fit more tolabelnum
- the
-cflag should always hide all the numbers, it is actually useful mostly with categorical data
- I think when option
label_valueorlabel_stepis used,labelnumshould be ignored. So the min max values won't be displayed. I hope we could get some feedback from other users what kind of behavior would be more natural.
comment:5 by , 8 years ago
Replying to annakrat:
Thanks, I tested it and it works very well. I have couple of suggestions:
- if you compare the default before and after this change, the white border is now transparent, so that should be changed back. Also if you test categorical data, the black/white border is switched (inner is black, should be white). The current default legend size is wider than the previous one, that should be fixed as well.
It's fixed, it should be the same like before.
- drawing ticks should be optional, implement for example '-t' flag. Question is if it should draw the ticks by default or not. Let's switch them off by default for now.
-t option added. By default ticks are switched off.
- the vertical centering of the labels and ticks is not quite perfect, I wonder if it could be improved
It's the same problem with fonts like in d.grid. Centering works fine for default GRASS_FONT. The problem is there's a constant which define the width/height ratio of a letter.
- I thought more about the names of the new parameters and decided
label_valuesandlabel_stepwould fit more tolabelnum
I changed both option names.
- the
-cflag should always hide all the numbers, it is actually useful mostly with categorical data
-c flag now hide all labels. G_option_exclusive is used so user can't use c flag with label_value or label_step option.
- I think when option
label_valueorlabel_stepis used,labelnumshould be ignored. So the min max values won't be displayed. I hope we could get some feedback from other users what kind of behavior would be more natural.
I add G_option_exclusive but please test it if everything is OK.
comment:7 by , 8 years ago
| Milestone: | 7.3.0 → 7.2.0 |
|---|---|
| Resolution: | → fixed |
| Status: | new → closed |
Currently legend has ticks in regular intervals depend on
labelnum. The aim is to add option e.g.steps=100for display label every hundred orlabels_at=[list of values]to add one or more labels at specific values? (value would have to be min < label_at < max)